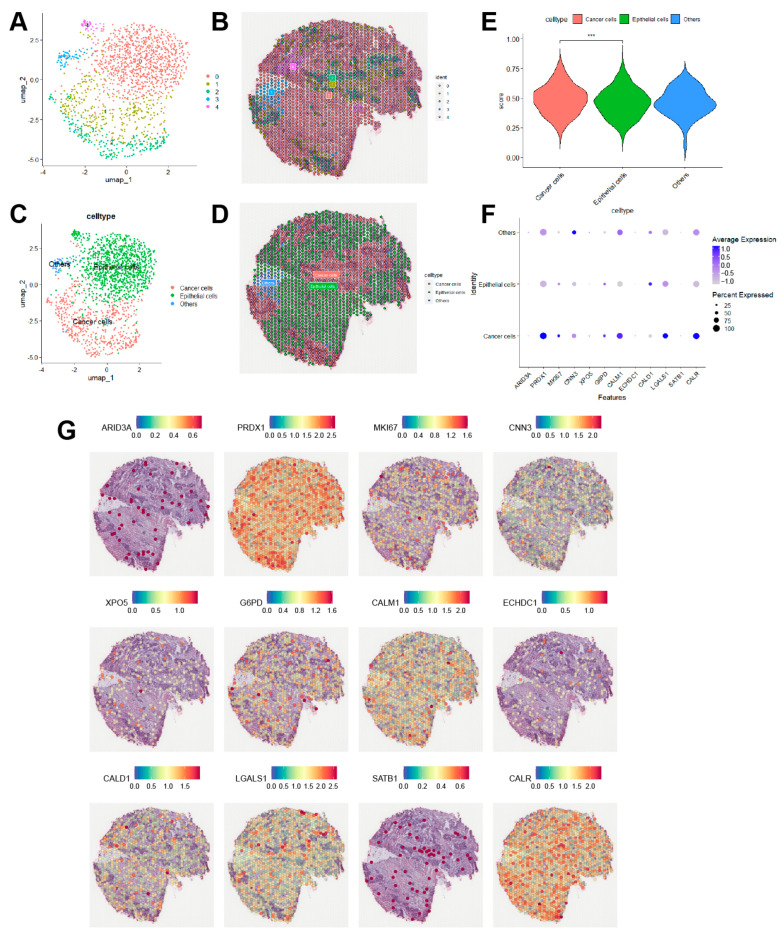
Figure 11.
Spatial transcriptome analysis in BLAC. (A,B) Dimensionality reduction Umap plot of spatial transcriptomics data and spatial distribution map of each cluster. (C,D) Umap plot and spatial distribution of each cell type after annotation. (E) Scores of model for each cell group. *** p < 0.001. (F) Bubble plot indicated that 12 model genes were significantly higher in cancer cells than in epithelial cells. (G) Spatial distribution of 12 model genes.

