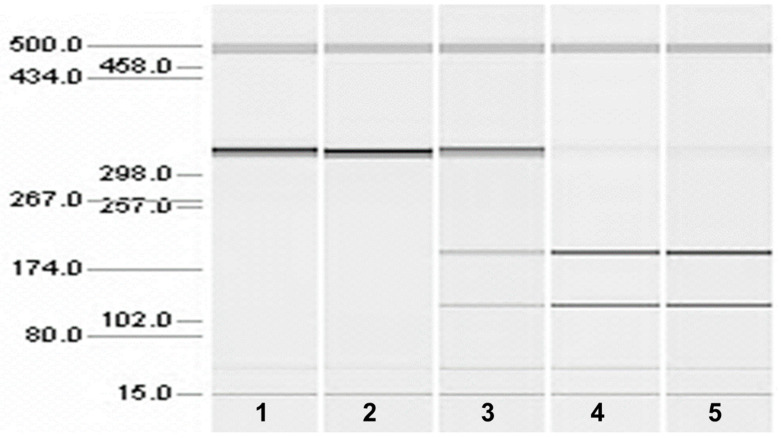
Figure 6.
Microcapillary electrophoretograms of amplicons produced from the RFLP-PCR genotyping assay with DNA from two CMSD-affected KBTs (lanes 1 and 2), DNA from a clinically normal KBT with a “carrier” (heterozygous) test result (lane 3), and two other clinically normal KBTs with a homozygous normal test result (lanes 4 and 5). The bands at 15 bp and 500 bp are from internal molecular weight markers.

