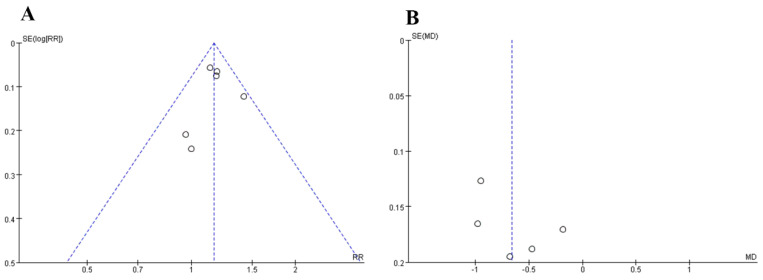
Figure 9.
Funnel plots of bias. (A): Rehabilitation evaluation; (B): visual analogue scale. The horizontal axis represents the effect quantity, and the vertical axis represents the accuracy. Each point represents a study included in the meta-analysis. The blue dashed line represents the distribution of the study effect size when there is theoretically no publication bias.

