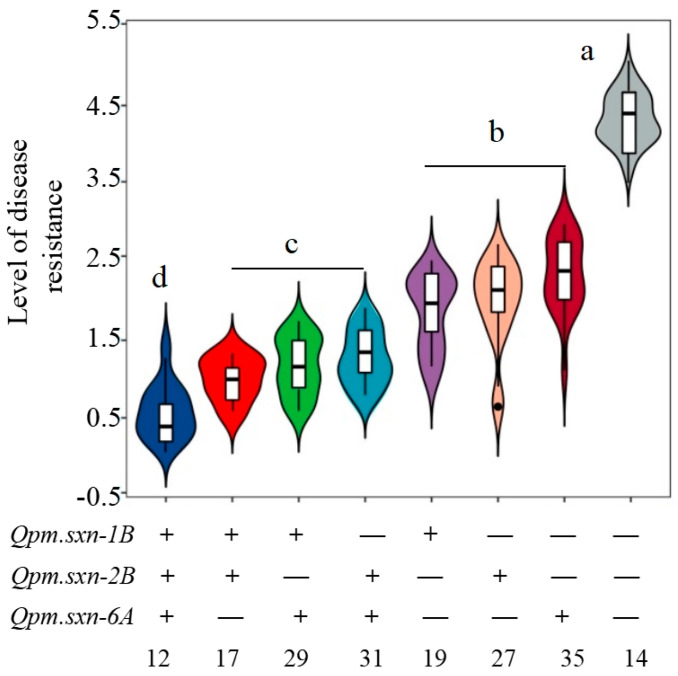
Figure 4.
The disease levels for DHs with different QTL combinations in the Jinmai 33/Yannong 19 of 184 DH populations. The plus and minus represent lines with and without the positive alleles of the target QTL based on the flanking markers and the corresponding QTL. The numbers of lines carrying the corresponding number of favorable alleles are shown below the horizontal coordinate, and the letter above the bars indicate comparisons at the significant level of 0.05.

