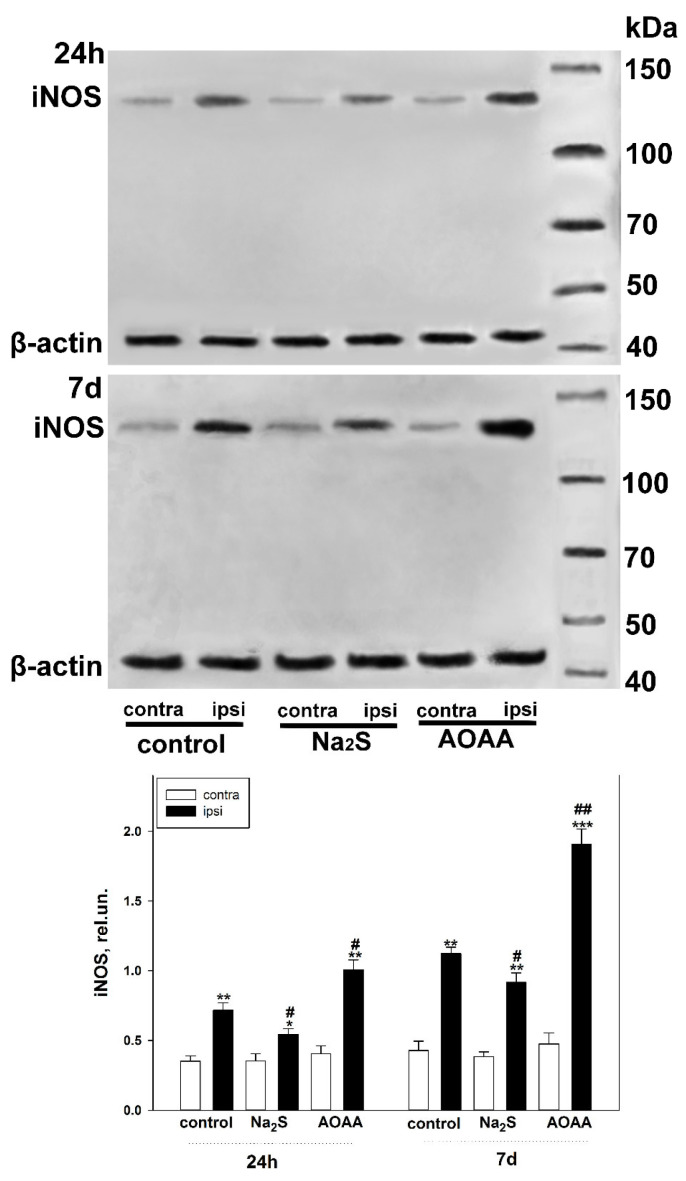
Figure 4.
Western blot analysis of iNOS levels in the total brain fraction obtained from control and experimental groups 24 h and 7 days after TBI. One-way ANOVA. M ± SEM. n = 6. * p < 0.05, ** p < 0.01, *** p < 0.01—ipsilateral cortex relative to the contralateral cortex of the same animal; # p < 0.05, ## p < 0.01—ipsilateral cortex of the experimental group compared to the ipsilateral cortex of the control group within the same time period after injury.

