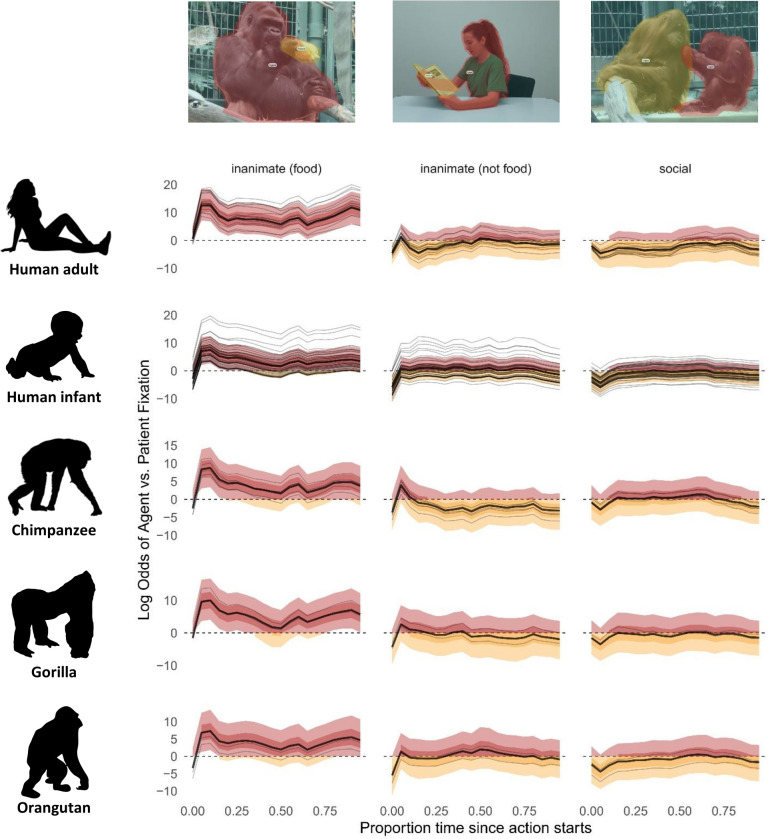
Fig 1.
Model predictions of log odds ratio for fixation to either agent (red) or patient (orange) over time. Thick lines represent the grand mean, thin lines represent individual participants. Time point 0 on the x-axis indicates action start time, normalized across stimuli. Light shaded ribbons indicate 90% credible intervals. When these exceed 0, there is a 90% probability of gaze to the agent (light red); when they are below 0, there is a 90% probability of gaze to the patient (light orange); when they include zero, there is a 90% probability that gaze alternates between agent and patient. The darker shaded ribbons indicate the middle 50% of the posterior probability mass.

