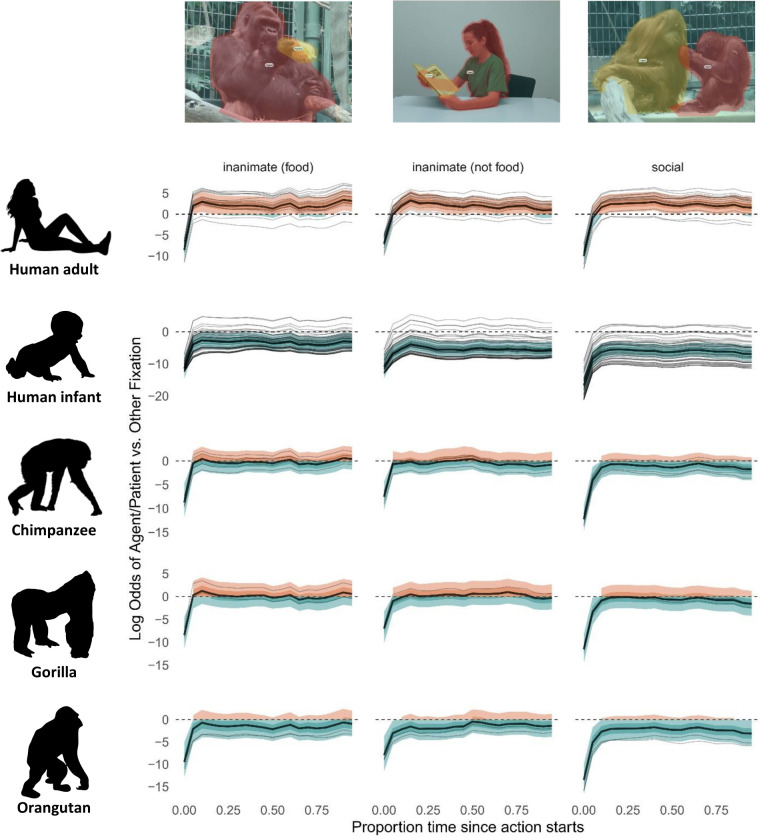
Fig 2.
Model predictions of log odds ratio for fixation to agent or patient (orange) versus other (turquoise) over time. Thick lines represent the grand mean, thin lines represent individual participants. Time point 0 on the x-axis indicates action start time, normalized across stimuli. Light shaded ribbons refer to 90% credible intervals. They exceed 0 for humans, indicating gaze priority for agents and patients (orange). They are below 0 for human infants (turquoise) (with the exception of inanimate food), indicating gaze primarily to background information; 90% credible intervals for apes border around 0, indicating that attention is divided between agents and patients (orange) and other information (turquoise). Darker shaded intervals indicate the middle 50% of the posterior probability mass.

