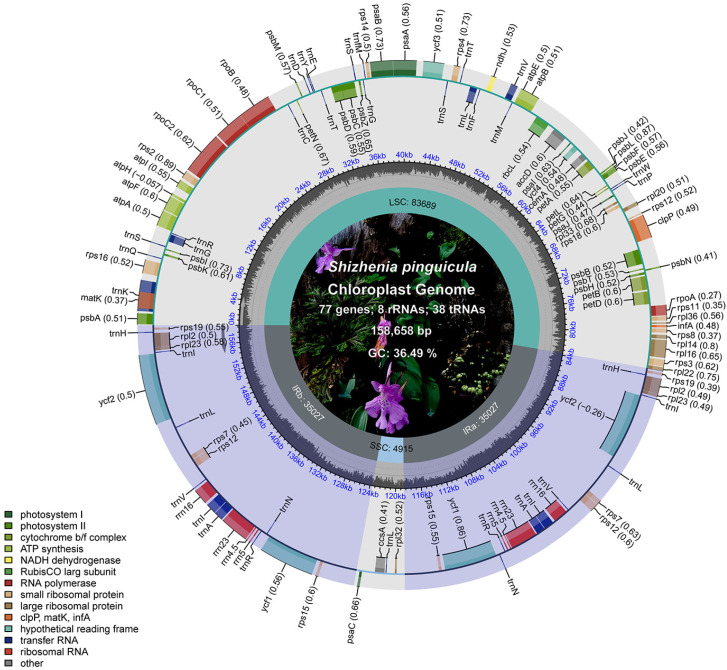
Figure 2.
Physical map of the cp genome in S. pinguicula. The gray column chart in the inner circle represents the GC content. The inner and outer sides of the outer circle represent the genes in clockwise and counterclockwise directions, respectively. Different color blocks represent gene groups with different functions, and the functions corresponding to the colors are annotated in the lower left corner.

