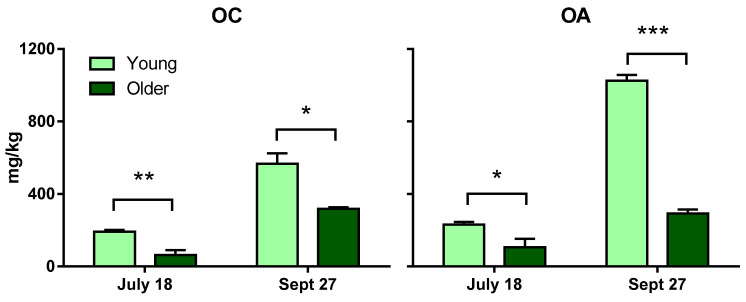
Figure 3.
OC (left) and OA (right) amounts, expressed in mg/kg of leaves, in older leaves (dark green) and younger leaves (light green) of Ligustrum vulgare, at two time points during the summer (July 18) and fall (September 27) of 2022. Each bar represents the mean of three repetitions ± SEM. Statistics: unpaired t-test with Welch’s correction, * p < 0.05; ** p < 0.005; *** p < 0.0001.

