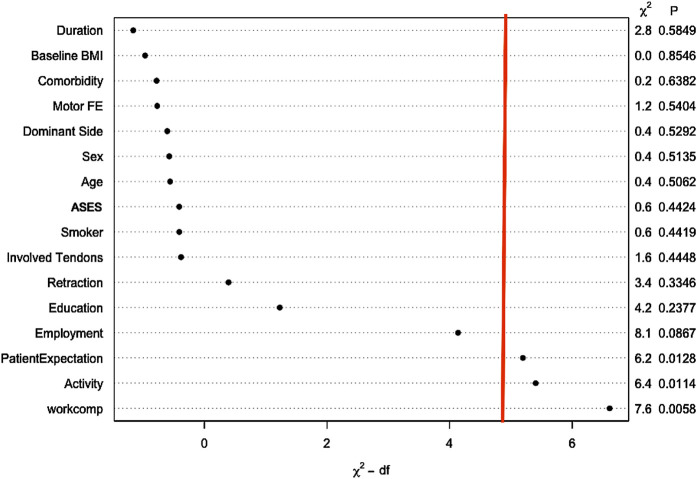
Fig. 3.
Predictors of later surgery (6 months to 10 years). This graph reflects the characteristics of patients who underwent surgery after 6 months of enrollment. The strength of each predictor is reflected by its position on the x axis. Predictors to the right of the vertical red line were significant (p < 0.05). Significant predictors of later surgery include patient expectations, activity level, and Workers’ Compensation status. Workers’ Compensation status and activity level were stronger predictors of later surgery than patient expectations regarding the effectiveness of physical therapy. df = degrees of freedom.

