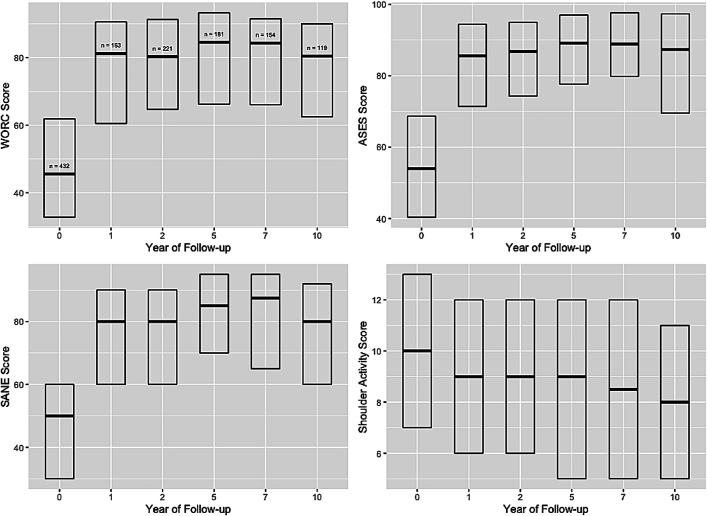
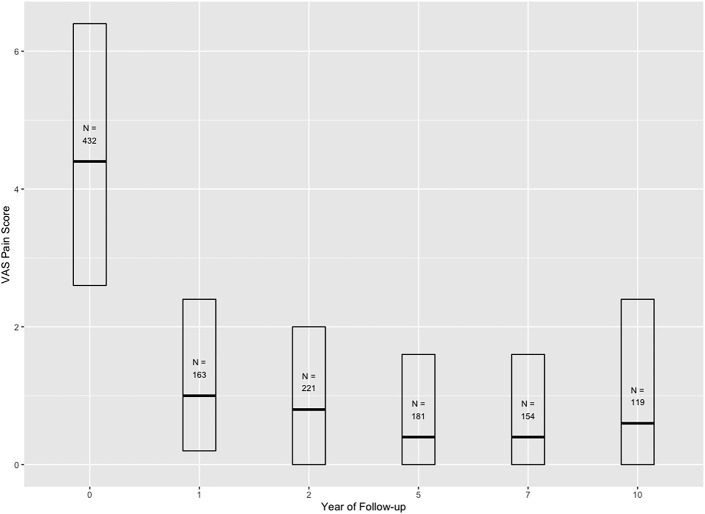
Figs. 5-A and 5-B Changes in PROMs over time. The interquartile range is denoted by a box, and the median is denoted by a line within the box. PROMs improved with physical therapy, exceeding the minimal clinically important difference for the measures utilized. The Western Ontario Rotator Cuff score, American Shoulder and Elbow Surgeons score, Single Assessment Numeric Evaluation, and Shoulder Activity Score were stable over the 10-year follow-up period (Fig. 5-A). Similar findings occurred for VAS pain scores (Fig. 5-B). The sample sizes (N) show the group size available at each year of the follow-up, with zero on the x axis indicating baseline assessment at the time of enrollment. The N values are shown on only 1 plot in each figure but are the same for all plots.

An official website of the United States government
Here's how you know
Official websites use .gov
A
.gov website belongs to an official
government organization in the United States.
Secure .gov websites use HTTPS
A lock (
) or https:// means you've safely
connected to the .gov website. Share sensitive
information only on official, secure websites.

