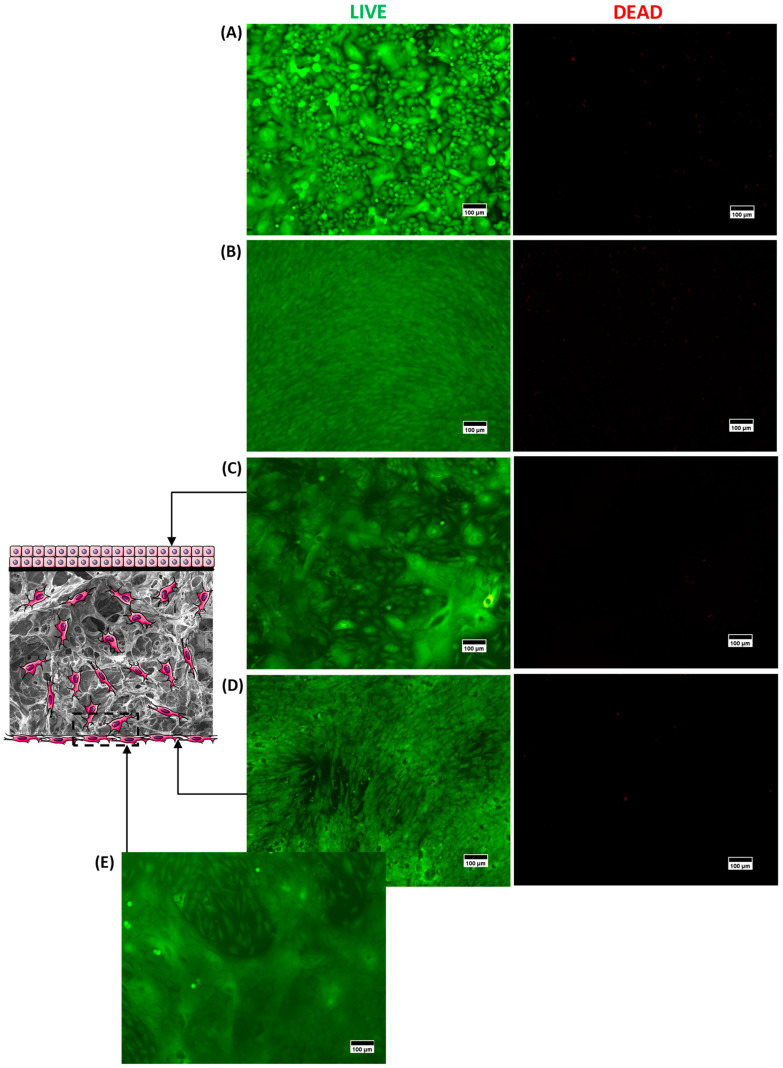
Figure 7.
Fluorescence microscopy images showing representative images of the 3D CMC:PVA:CHI_L-Arg structure, where a co-culture of (C) keratinocytes (upper face—membrane) and (D,E) fibroblasts (lower face—porous structure) were seeded compared to controls ((A) Keratinocyte +Control and (B) Fibroblast +Control). Cells were labeled with calcein AM (viable cells, green fluorescence, left column, identified as LIVE) and ethidium homodimer (dead cells, red fluorescence, right column, identified as DEAD). Scale bar = 100 µm. Detail: schematic representation of cell therapy dermal–epidermal skin substitute (not to scale).

