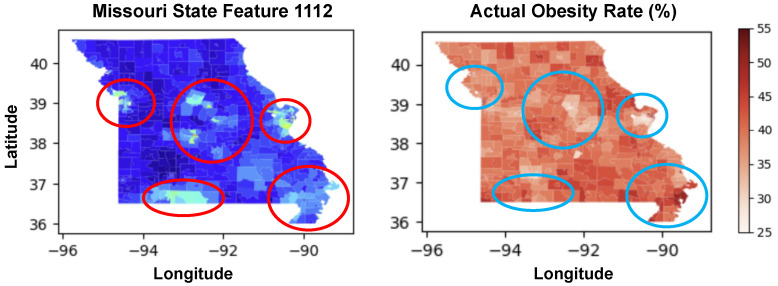
Figure 8.
The left map shows spatial distribution of Feature 1112 across Missouri, with red circles highlighting areas of high values (urban areas). The right map depicts actual obesity rates (%) across the state, with blue circles indicating regions with lower obesity prevalence. Notable discrepancies between feature values and obesity rates can be observed in several regions.

