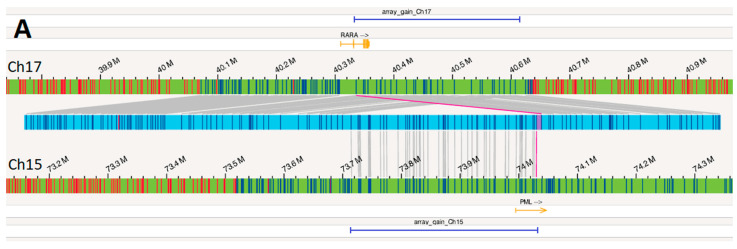
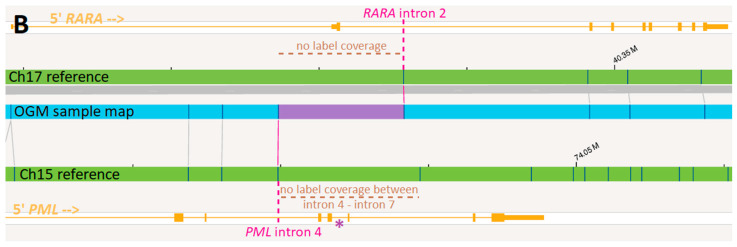
Figure 4.
(A) The OGM map (light blue horizontal bar) between the reference for chromosome 17 (green bar above the OGM map) and reference for chromosome 15 (green bar below the OGM map) where the dark blue vertical lines on the OGM map indicate OGM labels mapping to the two references as indicated by the gray lines. The RARA gene is shown in orange above the chromosome 17 reference and the PML gene in orange is shown below the chromosome 15 reference. Regions of gain identified by CMA are shown by horizontal dark blue bars. (B) Zooming into the rearrangement occurring in PML and RARA (solid pink line in Figure 4A), OGM provides breakpoints within intron 2 of RARA and intron 4 of PML (pink dotted lines). Due to lack of label coverage (brown dotted lines), the actual breakpoint within PML could have potentially occurred anywhere between intron 4 and intron 7. PML bcr1 at intron 6 (purple asterisk) was described as the fusion site by RT-PCR.


