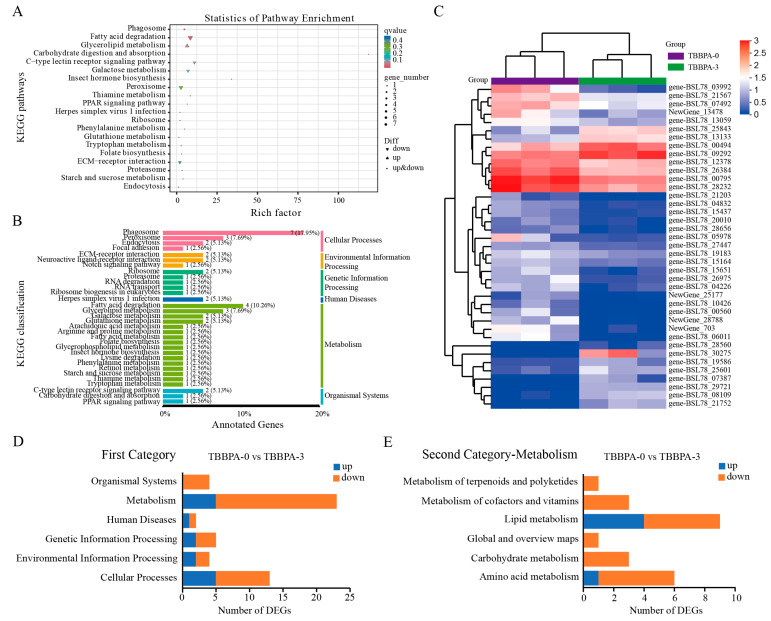
Figure 8.
KEGG pathway enrichment analysis of DEGs in the regenerated intestines between the control (TBBPA-0) group and the TBBPA-3 group. (A) The top 20 pathways of KEGG pathways were revealed. (B) The KEGG classification and proportion of pathways. (C) The heatmap of DEGs in the regenerated intestines between the control and the TBBPA-3 groups. (D) The number of KEGG pathways in the first category in the regenerated intestines of A. japonicus between the control and TBBPA-3 groups. (E) The number of KEGG pathways for metabolism in the second category in the regenerated intestine of A. japonicus between the control and TBBPA-3 groups. TBBPA-0 and TBBPA-3 means the 0 nmol/L TBBPA exposure group and the 3 nmol/L TBBPA exposure group, respectively.

