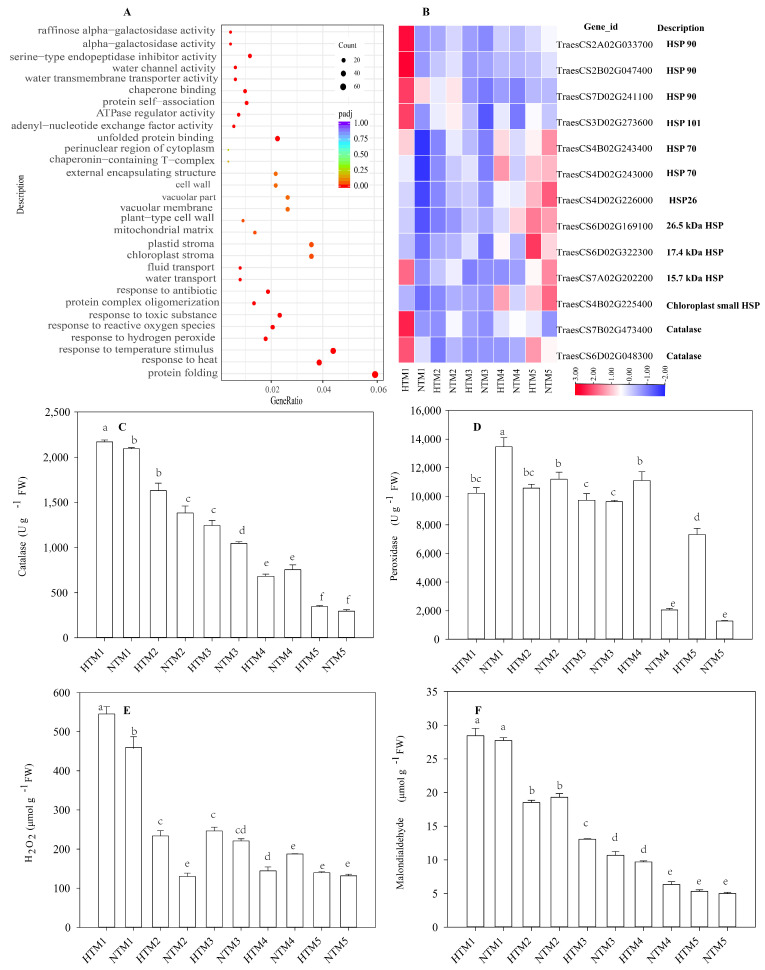
Figure 5.
GO analysis and the enzyme activity of the antioxidant system, as well as the response of H2O2 and MDA to HT. (A) GO analysis of upregulated DEGs in HTM1 versus NTM1. (B) HSPs and catalase gene expressions in BS253 grains in response to HT. The colors in the heatmap indicate gene expression levels across different samples. (C,D) Enzyme activity of the antioxidant system in response to HT. Bars represent the SE (n = 3). (E,F) H2O2 and MDA contents in response to HT. Bars represent the SE (n = 3), and the means with different letters are significantly different at p < 0.05.

