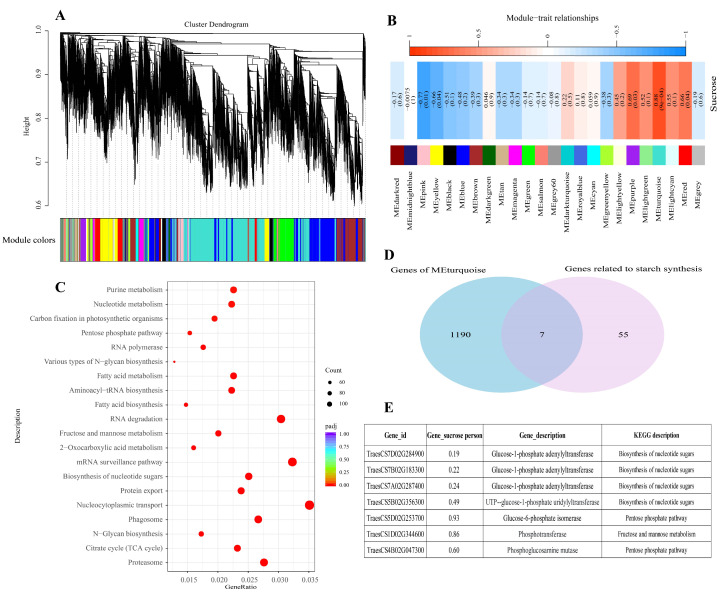
Figure 7.
Weighted gene co-expression network analysis. (A) A hierarchical clustering tree of genes was constructed based on the co-expression network analysis. (B) Module-and-sucrose content correlation. (C) KEGG enrichment analysis for genes from turquoise module. (D) Venn diagrams between significantly enriched genes (turquoise module) and the identified genes in the pathway from sucrose unloading to starch synthesis. (E) Hub genes in the starch synthesis pathway.

