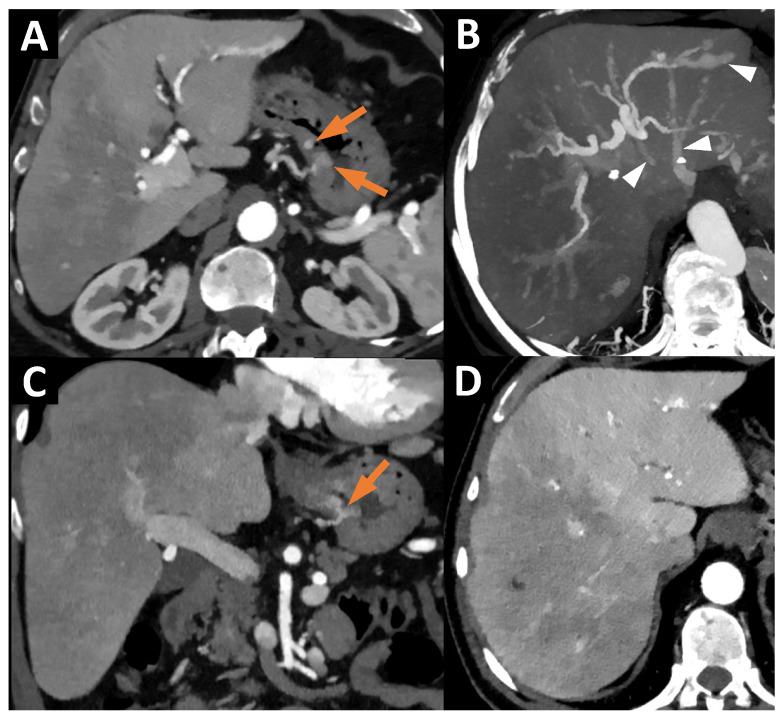
Figure 1.
(A) Axial CT at the arterial phase (40 keV reconstruction), showing telangiectases of the stomach body (orange arrows). (B) Axial CT at the arterial phase, with Maximum Intensity Projection (MIP) 25 mm, showing a voluminous arteriovenous shunt with early enhancement of the left hepatic vein (white arrowheads). (C) Coronal CT at the arterial phase (40 keV reconstruction), showing telangiectases of the stomach body (orange arrow). (D) Axial CT at the arterial phase (40 keV reconstruction), showing heterogeneous hepatic enhancement linked to the arteriovenous shunt between the left branch of the hepatic artery and the left hepatic vein.

