Figure 3.
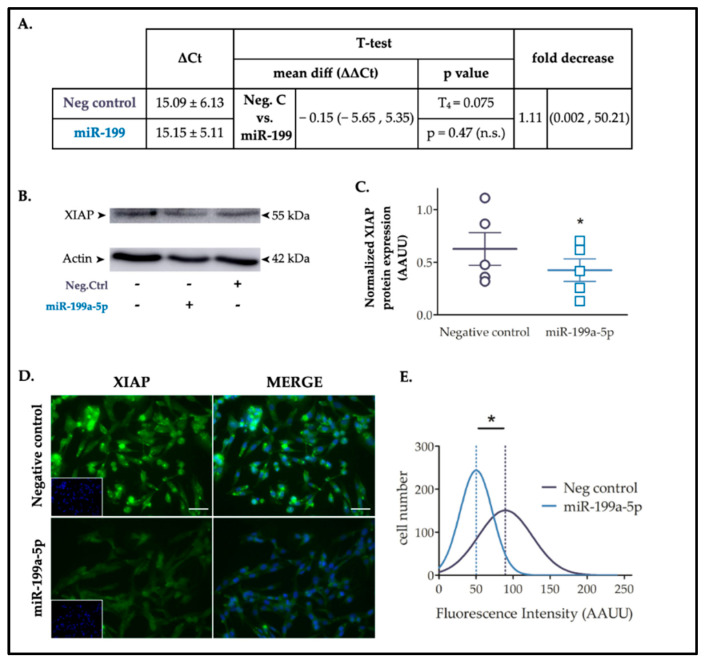
XIAP is a target of miR-199a-5p in C6 cells. (A) Statistical analysis of RT-qPCR results is provided in the table, employing a Student’s T test (n.s. = non significative). (B) Representative immunoblot of the expression levels of XIAP in protein samples extracted from C6 cells 24 h after transfection with either miR-199a-5p or negative control mimics. (C) Dot plot summary of the band densitometry from immunoblot analysis. Data were normalized by ß-actin levels for each sample. * p-value < 0.05 (paired t-test; n = 5 independent cell culture preparations). Lines represent mean ± SEM of n = 5 independent experiments. (D) Immunofluorescence assay of XIAP expression in non-transfected control, and negative control or miR-199a-5p mimic transfected C6 cells, labeled with a specific XIAP antibody (green) and DAPI (nuclei staining, blue). Bar scale = 100 μm. (E) Gaussian distribution graph of fluorescence intensity of XIAP staining in approximately 1500 cells per condition of C6 cells transfected with negative control (black line) or miR-199a-5p mimics (blue line). * p-value < 0.05 (Student’s t-test; n = 3 independent experiments with 5 images per experiment, analyzing approximately 300 cells per image). Dotted lines represent the mean fluorescence value for each distribution.

