Figure 4.
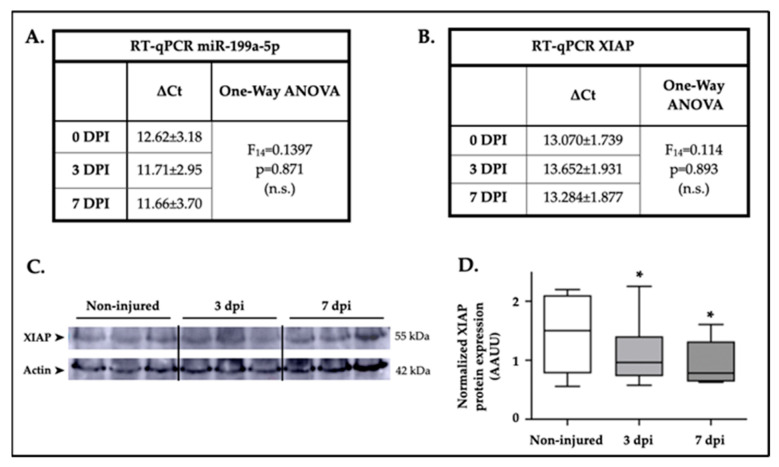
XIAP expression in the spinal cord was reduced after SCI. (A) Summary of RT-qPCR data showing miR-199a-5p gene expression levels in spinal cord samples at non-injured (0 dpi), 3 and 7 dpi. Results are based on data from five animals per group with 3 technical replicates each. Statistical analysis of the effect of dpi on gene expression is provided using one-way ANOVA (n.s. = non significative). (B) Summary of RT-qPCR data illustrating XIAP gene expression levels in spinal cord samples at non-injured, 3, and 7 dpi. The table presents results from five animals per group, with six technical replicates each. Statistical analysis of the effect of dpi on gene expression was performed using one-way ANOVA (n.s. = non significative). (C) Representative immunoblot depicting XIAP and β-actin protein expression in rat spinal cord samples at non-injured, 3, and 7 dpi from eight different animal surgery batches. (D) The box-and-whisker plots show XIAP protein levels in non-injured (white box), 3 dpi (light gray), and 7 dpi (dark gray) samples. Densitometry measurements were normalized to ß-actin levels for each sample (* p < 0.05 in paired t-test; n = 8 independent samples for each condition). In the box plots, the upper and lower boundaries represent the 25% and 75% quartiles, respectively, the line within the box marks the mean, and the whiskers above and below the box indicate the maximum and minimum values.

