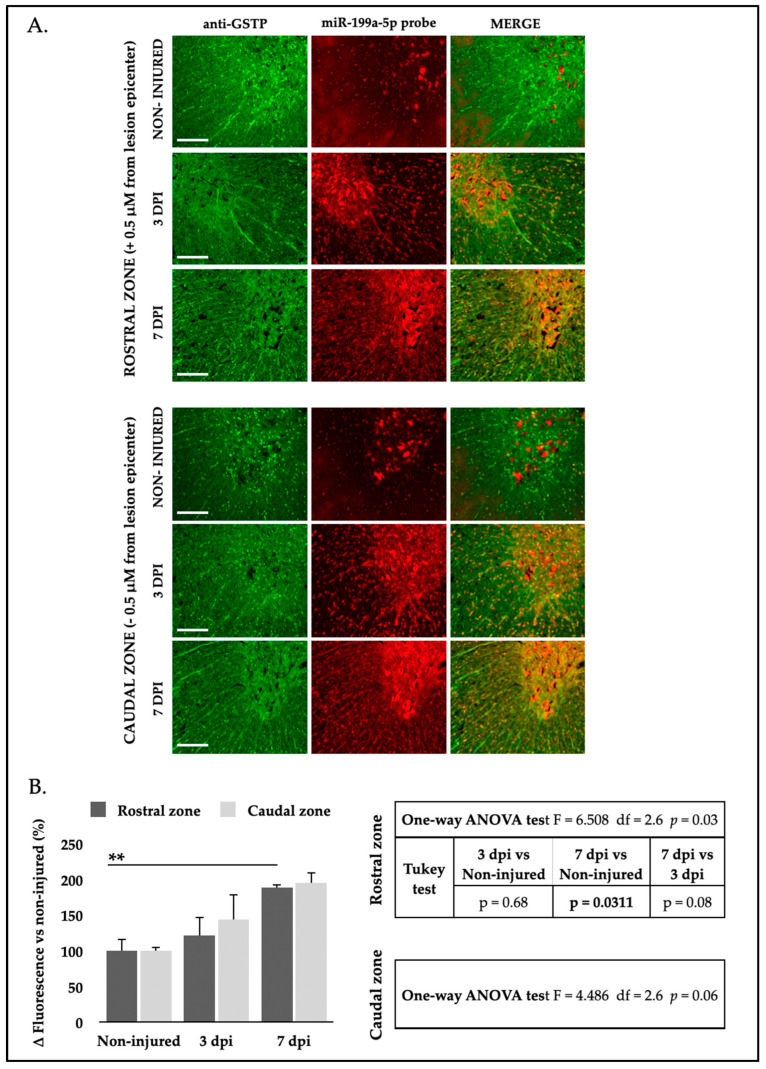
Figure 7.
SCI induces a significant upregulation of miR-199a-5p expression in oligodendrocytes. (A) Representative high-resolution confocal FISH-IF images of coronal sections showing both gray and white matter areas from uninjured (top row), 3 dpi (middle row), and 7 dpi (bottom row) rat spinal cords, co-labeled with anti-GSTP antibody (green, left column) and miR-199a-5p probe (red, middle column), displaying rostral (top panel) and caudal (bottom panel) regions (n = 3 animals per time point). Scale bar: 200 μm. (B) Analysis of miR-199a-5p staining intensity in rostral (dark gray bars) and caudal (light gray bars) spinal cord oligodendrocytes in non-injured animals and at 3 and 7 dpi. The graph represents the mean ± SD of sections from three animals per condition. Differences between conditions were analyzed using a one-way ANOVA test, followed by a Tukey’s post hoc test. ** denotes a significant difference (p < 0.01) relative to non-injured condition. For more detailed information on the analysis, please refer to the accompanying tables for the rostral zone (upper table) and the caudal zone (lower table).

