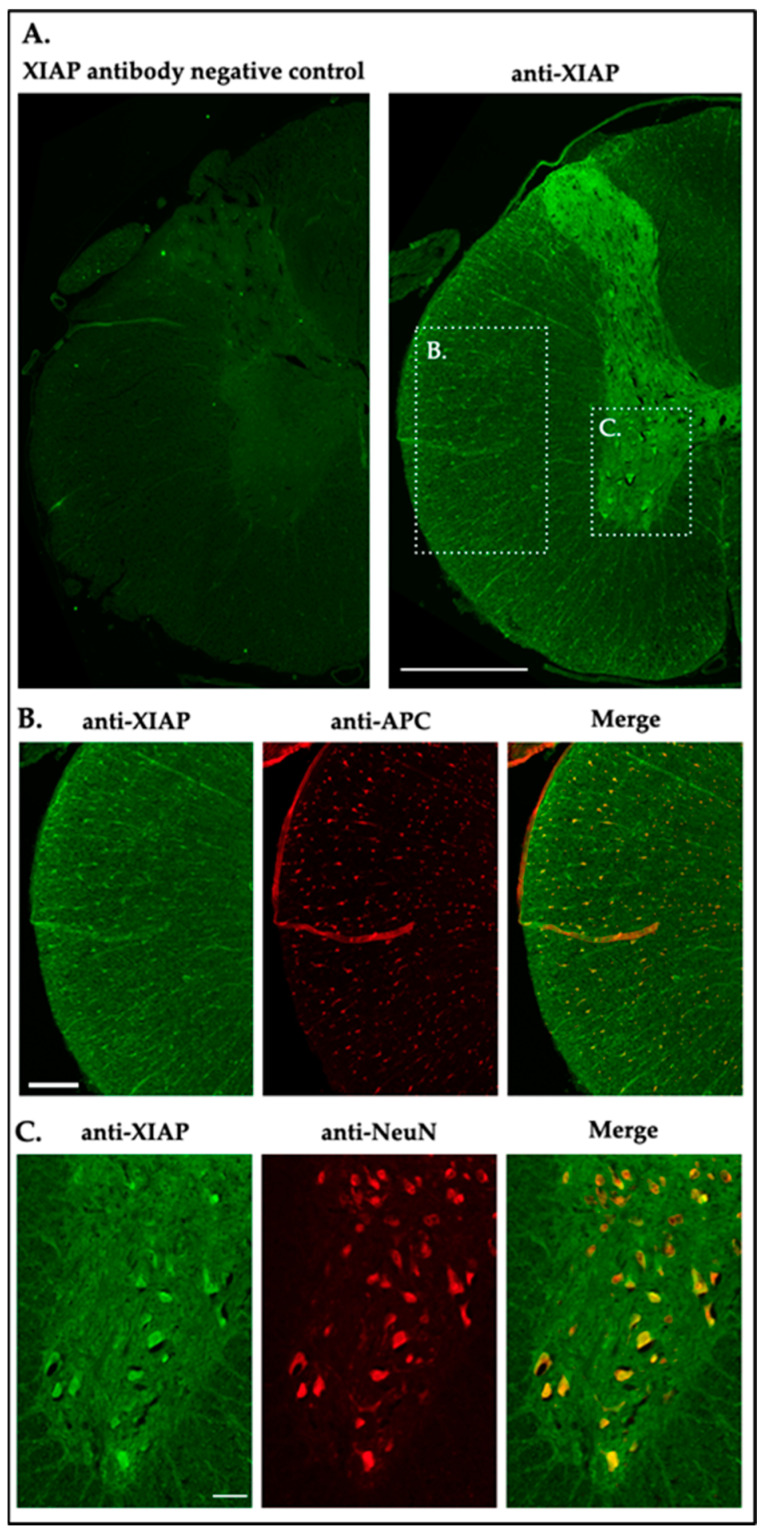
Figure 8.
XIAP expression in neural cells of the undamaged rat spinal cord. (A) Image of negative control in absence of anti-XIAP antibody on a coronal section of non-injured rat spinal cord (left) and XIAP staining in coronal sections of control spinal cords from non-injured rats (right; scale bar: 200 μm; n = 3). (B,C) Confocal images of the different areas indicated in ((A), white dotted line) showing XIAP expression (green, left) and co-expression with cellular markers (red, right) for oligodendrocytes (anti-APC; scale bar: 200 μm; middle panel) (B), and ventral neurons (anti-NeuN; scale bar: 50 μm lower panel) (C).

