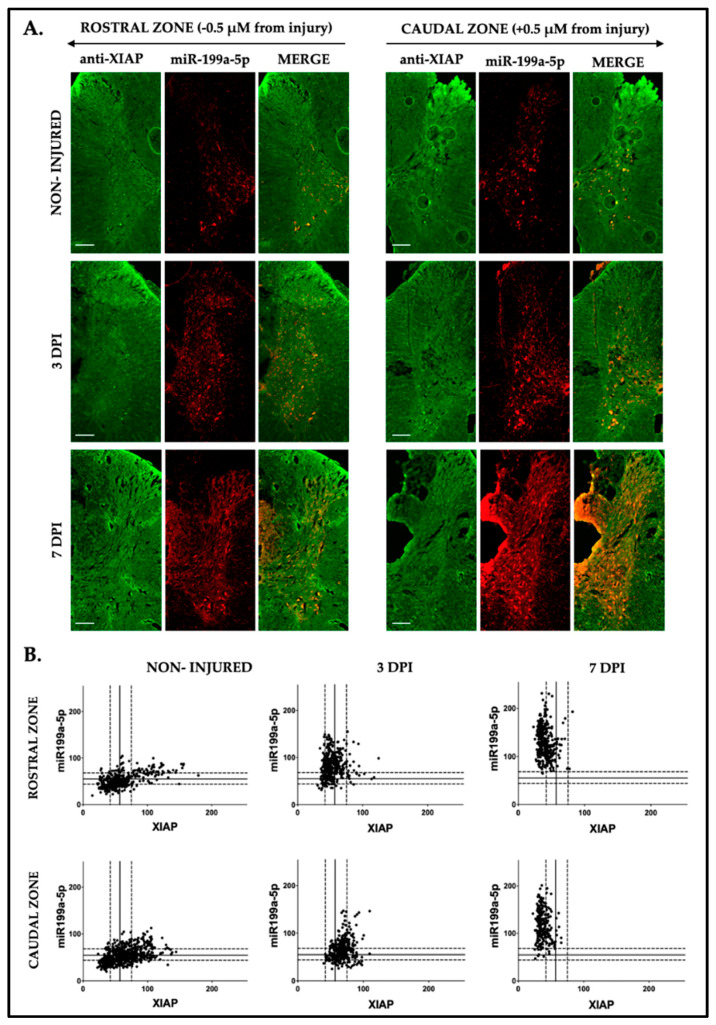
Figure 11.
Dynamic and dependent relationship between miR-199a-5p and XIAP in neuronal cells following spinal cord injury. (A) Representative FISH-IF confocal images of rat spinal cords hemi-coronal sections of non-injured (upper row), 3 dpi (middle row), and 7 dpi (lower row), co-labeled with anti-XIAP antibody (in green, left column) and miR-199a-5p probe (in red, middle column) (n = 3 individuals per time). Sections are about 0.5 mm away from injury epicenter. Scale bar: 200 μm. (B) Representative scatter plot images are shown from rostral (upper panel) and caudal zones (lower panel), with each point corresponding to the intensity values of miR-199a-5p (Y-axis) and XIAP (X-axis) per cell. Solid lines indicate the mean fluorescence intensity, while dotted lines represent the ± SD from the mean (n = 3 individuals per time).

