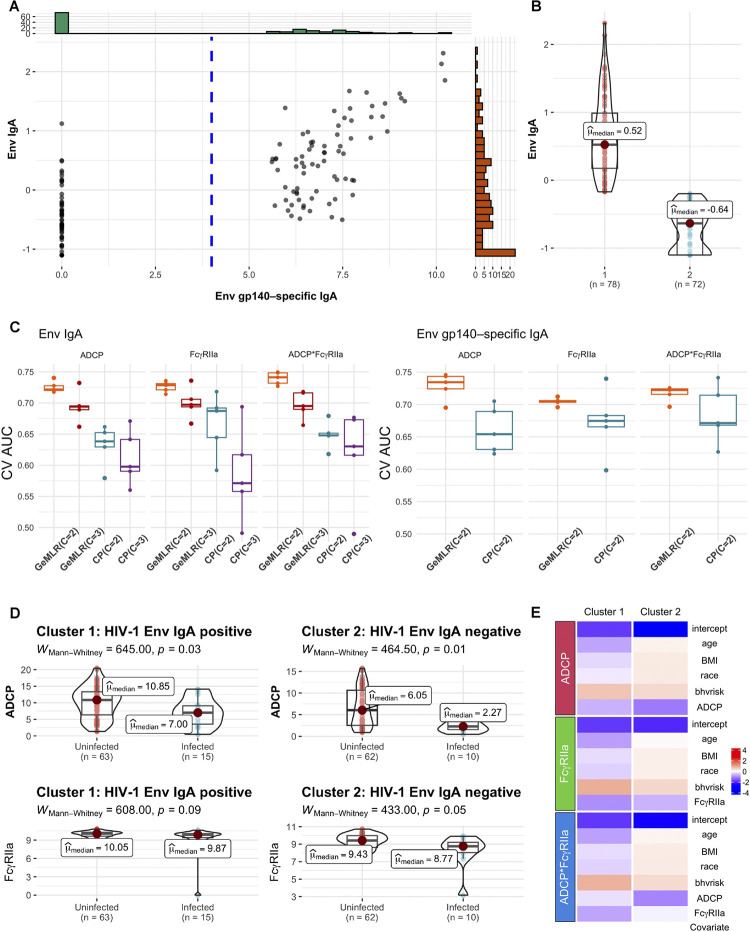
Fig 2. Visualizing GeM-LR results for HVTN 505 data.
A: Scatter plot of Env IgA vs. Env gp-140-specific IgA. The cutoff value 4 for Env gp-140-specific IgA is shown in blue dotted line; B: Violin plot of HIV-1 Env IgA for the two clusters generated by GeM-LR; C: Box plots displaying the AUCs of the 5-fold CV for five repetitions, comparing GeM-LRs and the CP methods with C = 2:3: The left panel is for methods employing Env IgA as the clustering variable, whereas the right panel is for methods utilizing Env gp140-specific IgA for clustering. D: Violin plots of ADCP (top rows) and FcγRIIa (bottom rows) by the infected/uninfected outcome, with y-axis showing the values for ADCP and FcγRIIa, respectively, stratified by GeM-LR clustering result; p-values are computed by the nonparametric Mann–Whitney test comparing whether ADCP/FcγRIIa differs in the two clusters; E: Heatmaps for visualizing the regression coefficients in the three GeM-LRs.

