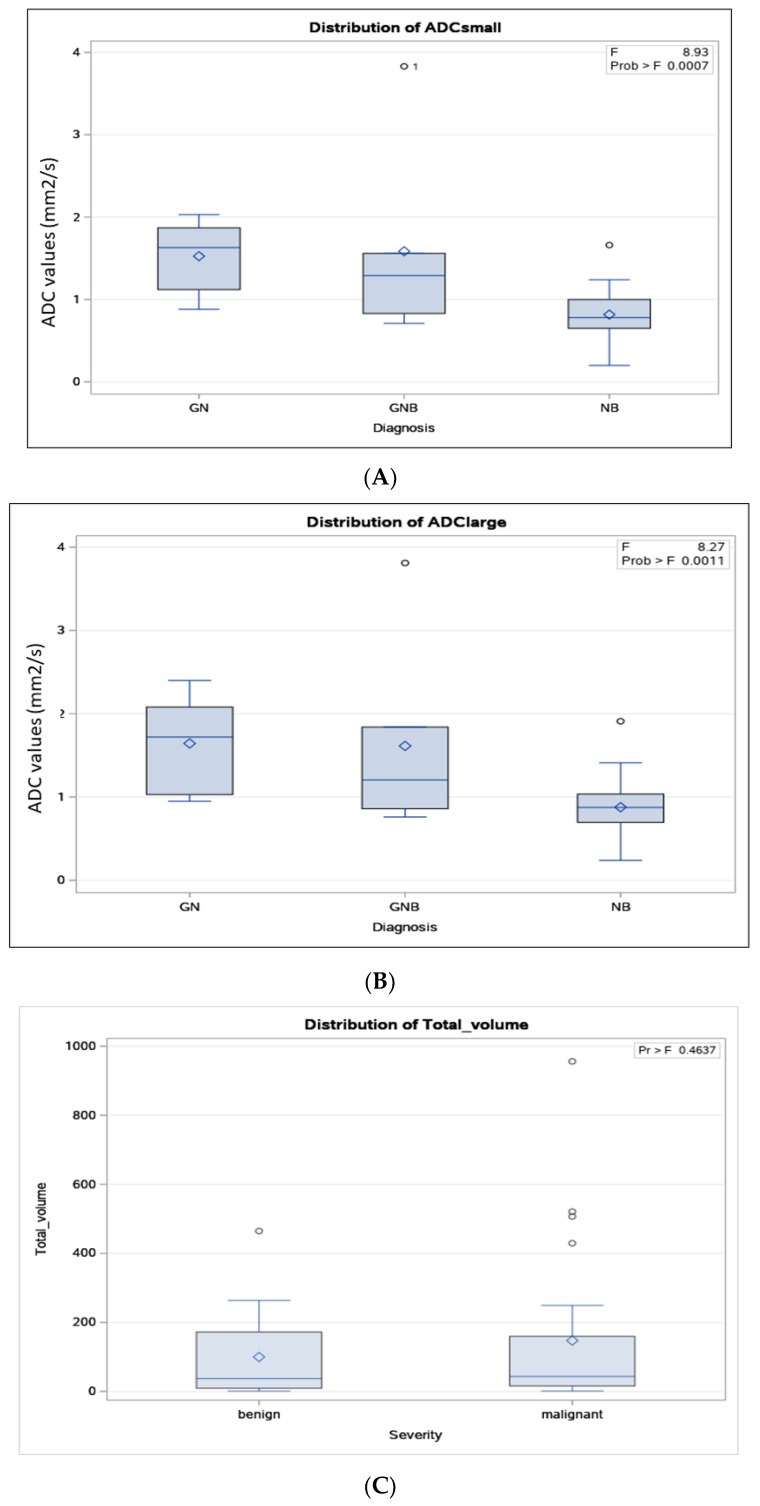
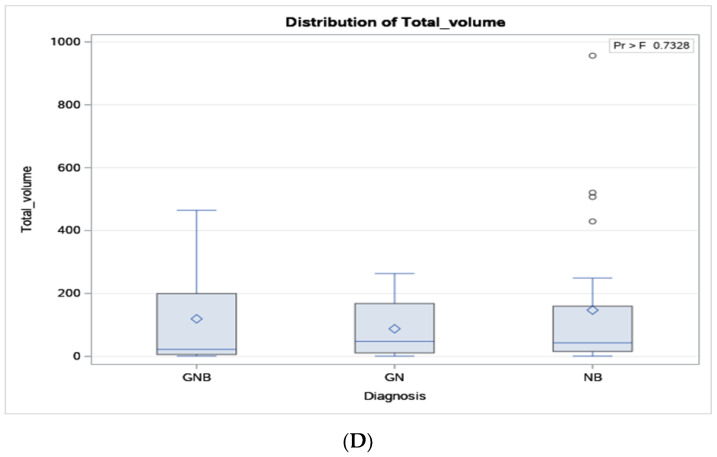
Figure 5.
Distribution of apparent diffusion coefficient (ADC) values according to the histopathologic results of the neuroblastic tumours for the small (A) and large (B) regions-of-interest (ROIs) method. Distribution of tumour volume according to benignity vs. malignancy of the neuroblastic tumours (C) and according to histopathologic results (D).


