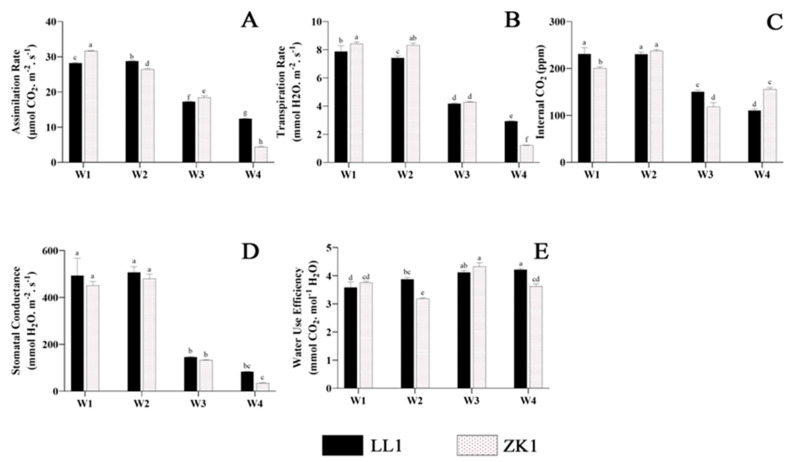
Figure 7.
The effects of different drought stress intensities on quinoa photosynthetic properties. (A) The assimilation rate. (B) The transpiration rate. (C) The internal CO2 content. (D) Stomatal conductance. (E) Water use efficiency. Note: vertical bars indicate the mean value ± SD (n = 3). The different lowercase letters indicate a significant difference (p < 0.05).

