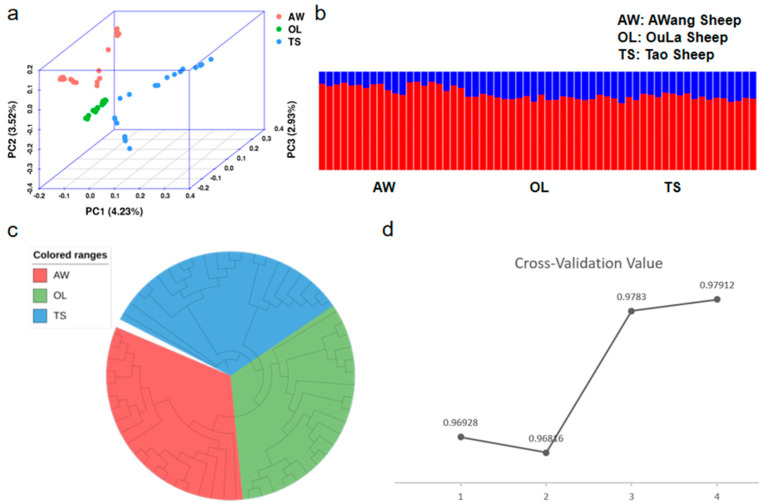
Figure 2.
Analysis of the genetic structure of the population: (a) principal component analysis (PCA) (each color represents a sheep population); (b) K = 2, population structure analysis (each color represents a specific ancestral component); (c) individual evolutionary tree (NJ tree) (each color represents a sheep population); and (d) cross-validation error (X axis represents K value).

