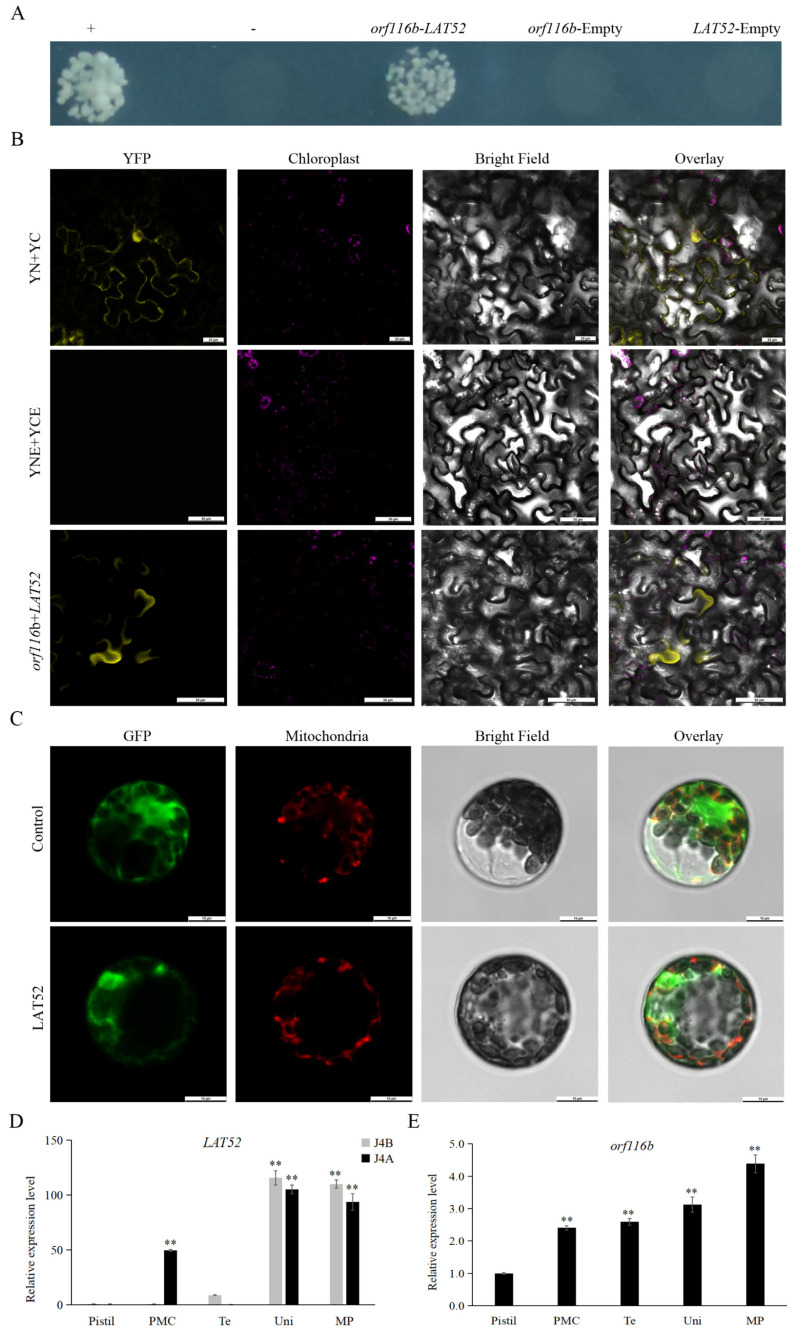
Figure 6.
Analysis of orf116b-LAT52 interaction and LAT52 and orf116b gene expression patterns. (A) Split-ubiquitin yeast two-hybrid assay shows the interaction of orf116b with LAT52 in yeasts. +, Positive control; −, negative control. (B) BiFC assay shows orf116b interaction with LAT52 in tobacco leaves. YNE + YCE, empty vector negative control; YN + YC, positive control; YFP, yellow fluorescent protein. Scale bars of (B) correspond to 50 μm. (C) Subcellular localization of LAT52 in Arabidopsis protoplasts. Green represents the green fluorescent protein (GFP) signal; bright red indicates the mitochondrial localization signal; orange-yellow and orange indicate the overlap of the green fluorescent signal and the red fluorescent signal; in other words, orange-yellow and orange indicate mitochondrial localization. Scale bars of (C) correspond to 10 μm. (D) The relative expression levels of the LAT52 in J4A and J4B pistils and anthers at different developmental stages. The error bars represent the standard deviation of three replicates, and ** indicates a significant difference compared to the control (relative expression levels in J4B’ pistil) at p < 0.01 (Student’s t-test). (E) The relative expression levels of orf116b in J4A anthers at different developmental stages within J4A. The error bars represent the standard deviation of three replicates, and ** indicates a significant difference compared to the control (relative expression levels in the pistil) at p < 0.01 (Student’s t-test). PMC, pollen mother cell stage; Te, tetrad period; Uni, uninucleate stage; MP, mature pollen grain stage.

