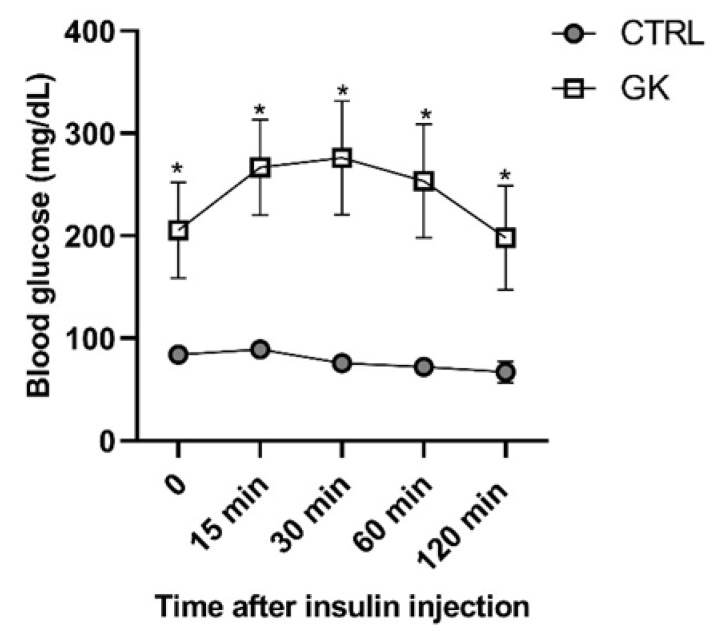
Figure 1.
Blood glucose concentrations of control (CTRL, n = 5) and GK animals (n = 6) measured before (time 0) and during the insulin tolerance test—ITT. Values are presented as mean ± SEM, and a paired Student’s t test was used to compare the two experimental groups (CTRL and GK). * Statistical difference, p < 0.05.

