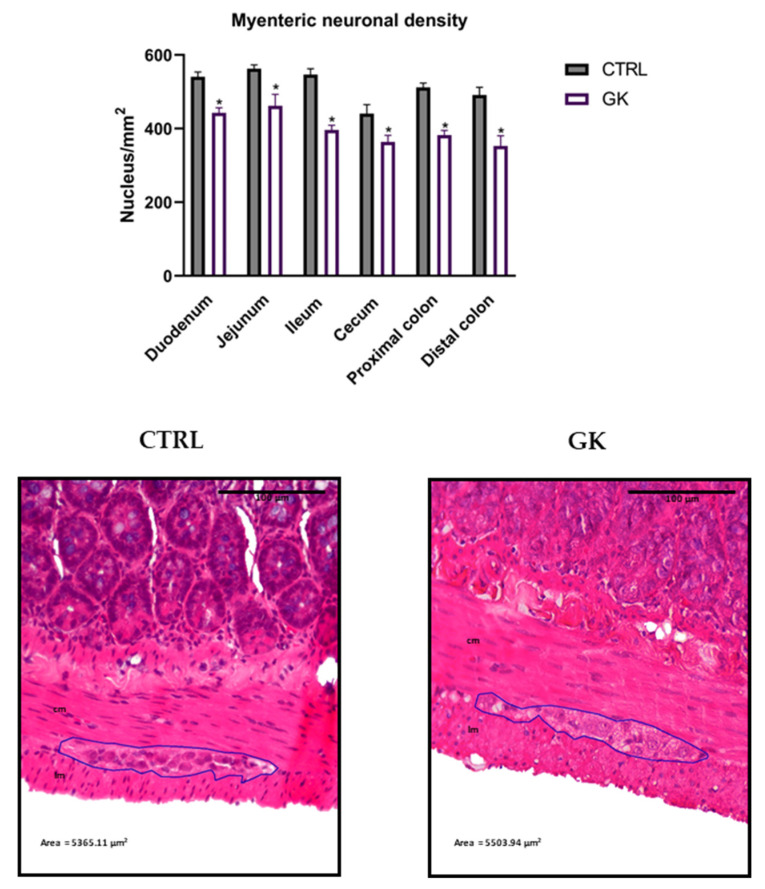
Figure 7.
Morphoquantitative analyses of the neuronal density in the myenteric plexus of duodenum, jejunum, ileum, cecum, and proximal and distal colon of control group (CTRL, n = 5) vs. GK diabetic rats (GK, n = 6). Data are expressed as the mean ± SEM, and comparisons between the two groups were made using Student’s t test. * Statistical difference, p < 0.05. Representative microscopic photographs of the myenteric plexus proximal colon of control (CTRL) and GK rats (GK) stained with hematoxylin and eosin, captured at 100× magnification. Longitudinal muscle (lm) and circular muscle (cm) were identified in both images.

