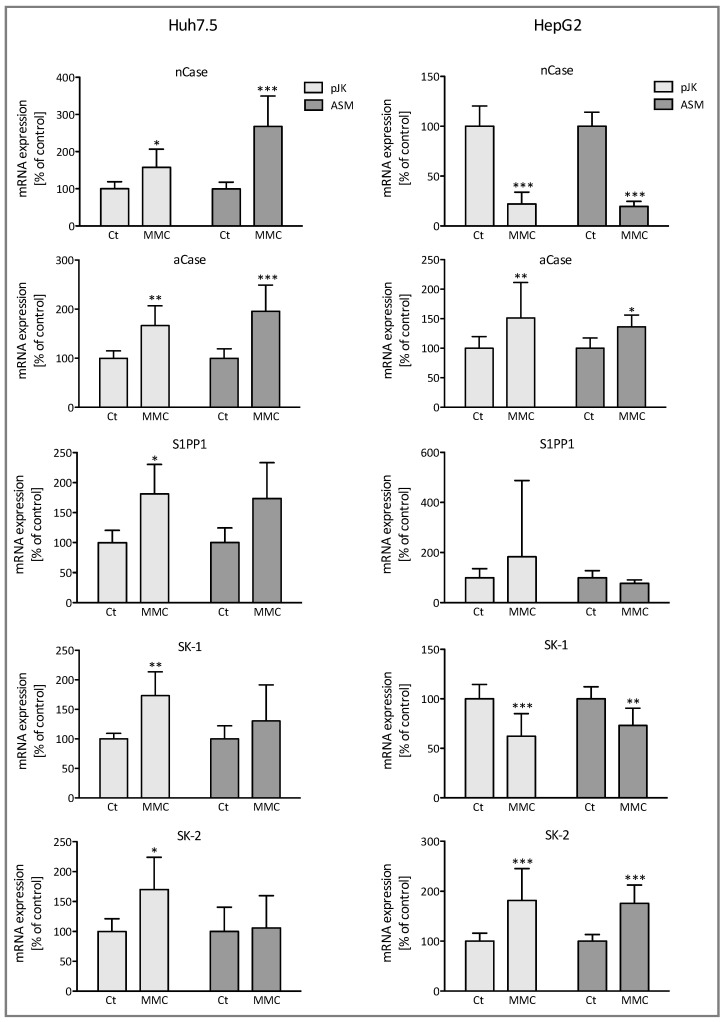
Figure 5.
The mRNA expression of various enzymes of the sphingolipid metabolism upon Mitomycin C treatment. The ASM transfected (ASM) and control transfected (pJK) Huh7.5 und HepG2 cells were incubated for 48 h either with or without 3 µM mitomycin C (MMC). The data were obtained by the ΔΔCt method as described in the methods section and are expressed in % of untreated control, shown are means ± SD (n = 3). *** p < 0.0001, ** p < 0.001, and * p < 0.05 are considered significantly different when compared to the control group.

