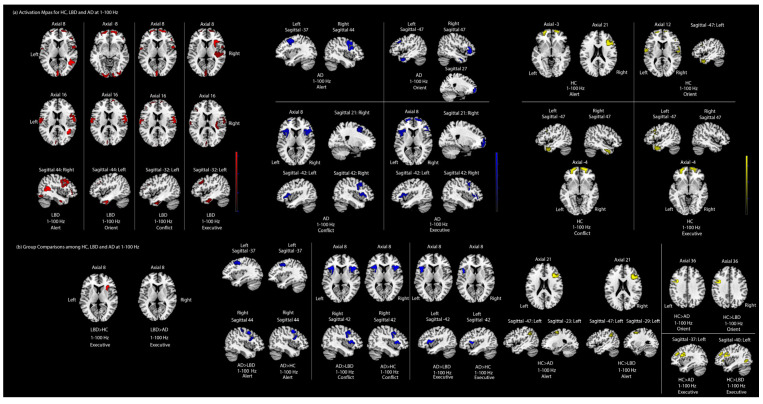
Figure 2.
Overall source-level EEG results at 1–100 Hz. (a) Within-group one-sample t-tests for ANT attentional activation maps among HC, LBD and AD. The results are uncorrected p < 0.001. Yellow, blue and red indicated the significant areas for HC, AD and LBD, respectively. (b) Between-group one-way ANOVA results for group comparisons among HC, LBD and AD. All activated areas are family-wise error corrected p < 0.05. Yellow, blue and red represent the stronger activations in corresponding group comparisons. (Yellow: HC > AD or HC > LBD; Blue: AD > HC or AD > LBD; Red: LBD > HC or LBD > AD).

