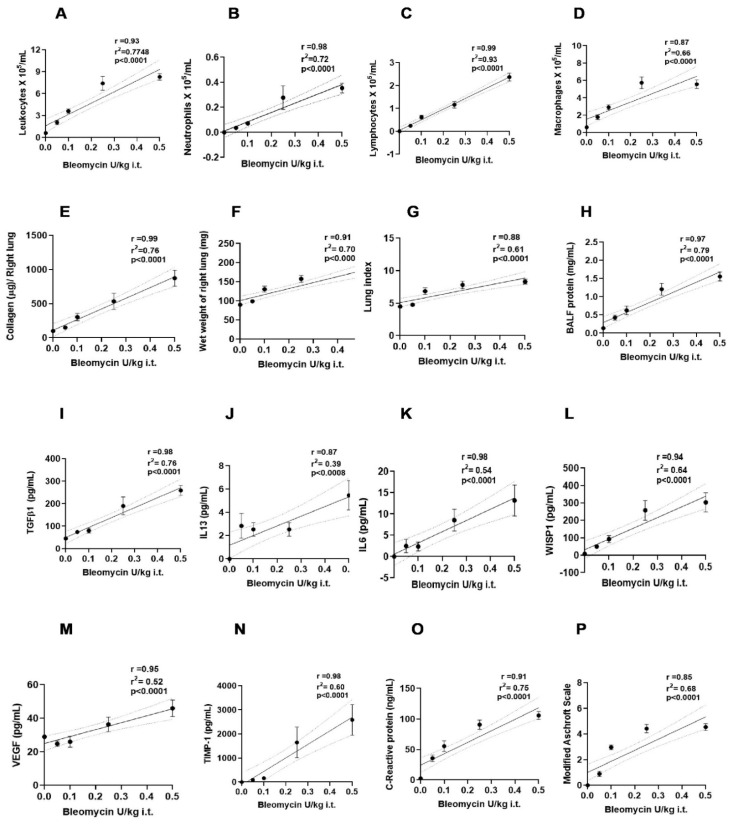
Figure 6.
Simple linear regression analysis between concentrations of bleomycin and features of experimental fibrosis. (A) leukocytes, (B) neutrophils, (C) lymphocytes, (D) macrophages, (E) collagen, (F) lung weight, (G) lung Index, (H) protein content, (I) TGFβ-1, (J) IL-13, (K) IL-6, (L) WISP-1, (M) VEGF, (N) TIMP-1, (O) CRP, (P) Modified Ashcroft Scale. Goodness of Fit: r2, Pearson correlation coefficient (r), n = 5/group.

