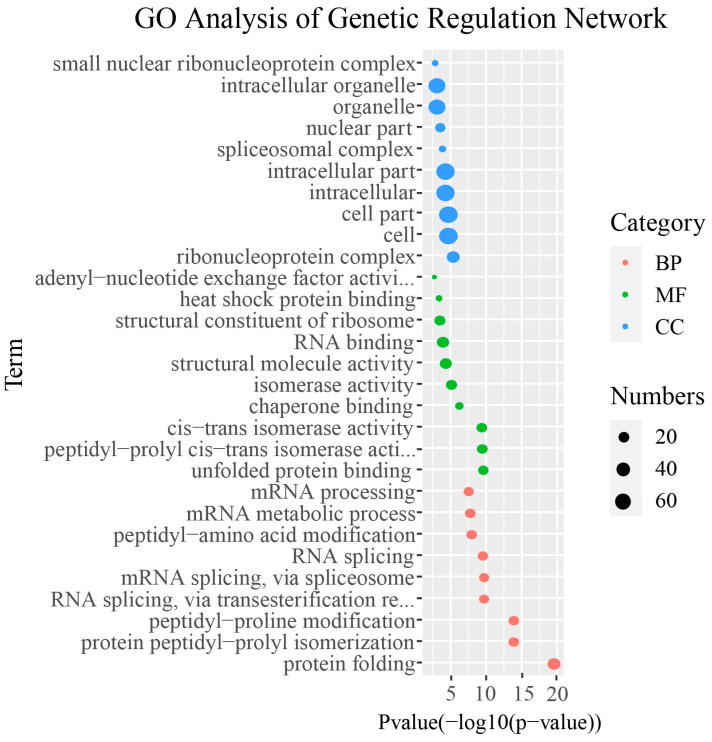
Figure 6.
A review of the genes that interact with MsPUB genes and their gene ontology enrichment. The GO terms for molecular functions (MFs), cellular components (CCs), and biological processes (BPs) are shown as red, green, and blue dots, respectively. The GO term is displayed on the Y-axis, while the X-axis displays the p-value of the topGO enrichment analysis with −log 10 transformation or −log 10 (p). The number of genes involved in the GO keywords is reflected in the size of the circles.

