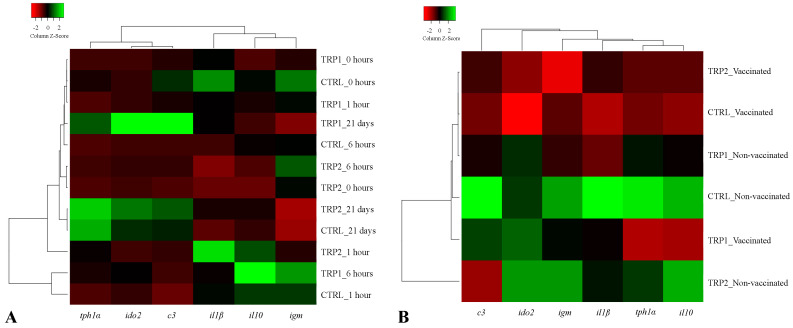
Figure 2.
Heatmap of relative mRNA gene expression on the head-kidney of vaccinated and non-vaccinated European seabass fed experimental diets (CTRL, TRP1, and TRP2) for 3 days before (A) and 3 days after the dip vaccine, and then vaccinated or not fish were fed CTRL until day 21 (B). tph1α—tryptophan 5-hydroxylase-like alpha; ido2—indoleamine-dioxygenase 2; c3—complement factor 3; il1β—interleukin 1 beta; il10—interleukin 10; and igm—immunoglobulin M. Lines represent the different dietary treatments and columns represent genes assessed. Pearson’s method was used to calculate the distance metric and relative mRNA levels were hierarchically clustered with the centroid linkage algorithm. Colours represent the intensity of the analysed gene; green more intense; red less intense.

