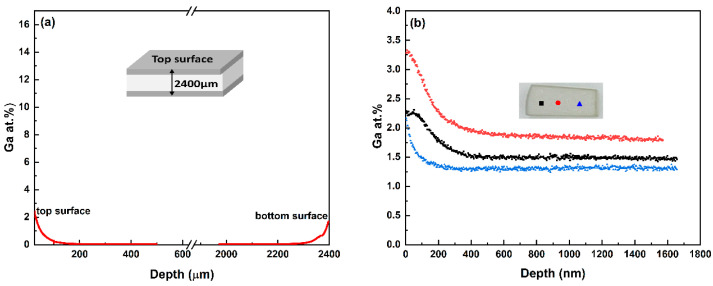
Figure 2.
(a) Ga concentration profiles throughout the cross-section by SIMS 2D-image mode. (b) Ga depth profiles measured on the surface by SIMS depth profiling mode. These measurements were taken at three different locations 800 µm apart, as shown on the inset, and are labeled red, black and blue for clarity.

