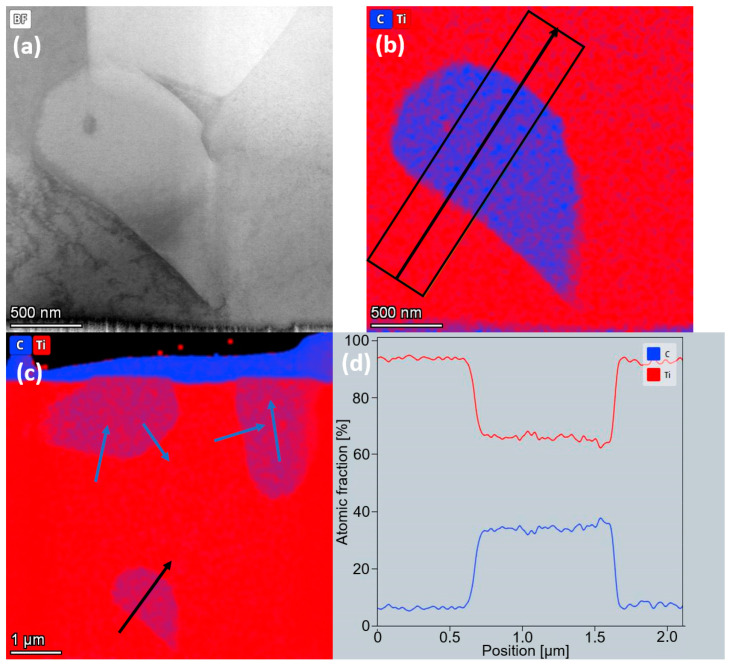
Figure 5.
TEM-EDS Ti and C mapping of a TiC grain of sample TiC23 after 24h heat treatment (a) Bright-field micrograph of a TiC grain surrounded by Ti grains. (b) C (blue) and Ti (red) EDS mapping for the same region. The black arrow depicts the profile analysed and the average width used in the profile presented in (d). (c) C (blue) and Ti (red) overlay of the TEM lamella with arrows depicting the C and Ti profiles studied. Blue arrows refer to profiles not presented here.

