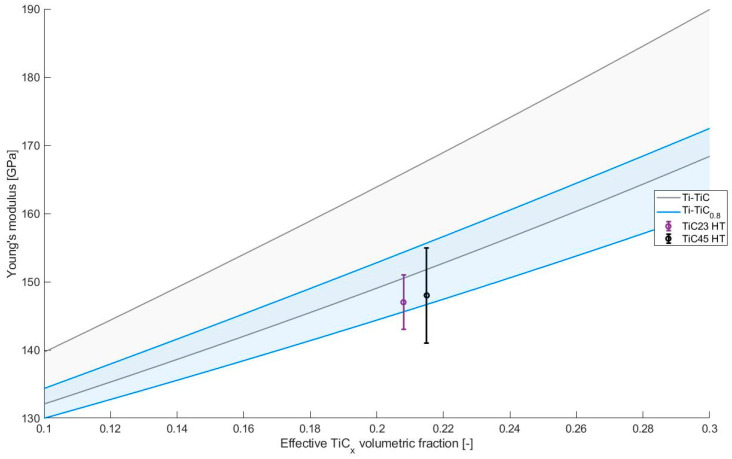
Figure 10.
Young’s modulus estimated by Hashin–Shtrickman bounds for Ti-TiC as a function of the TiC volumetric content [24]. Grey, green and blue regions provide the estimates for different C/Ti ratio in TiC. Experimental data from TiC23 and TiC45 in heat-treated conditions are visible in purple and black, respectively.

