Figure 1.
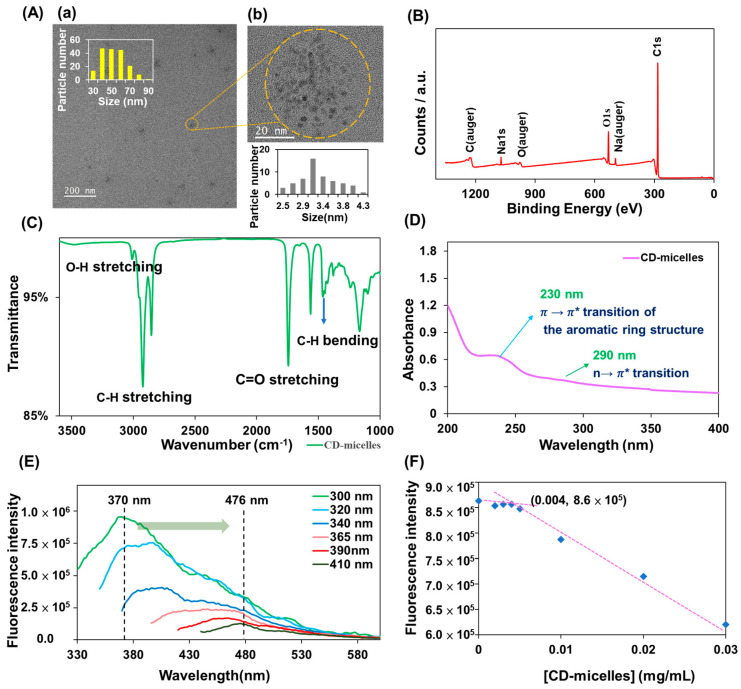
(A) HRTEM images, (B) XPS spectrum, and (C) FTIR spectrum of CD-micelles. (D) Absorption spectrum of CD-micelles in ultrapure water (0.16 mg mL−1) and (E) PL spectra of CD-micelles when excited at wavelengths of 300 to 410 nm. (F) Critical micelle concentration (CMC) assessment of CD-micelles. The insets (a,b) in (A) represent an enlarged image of the CD-micelles and their size distribution, respectively.

