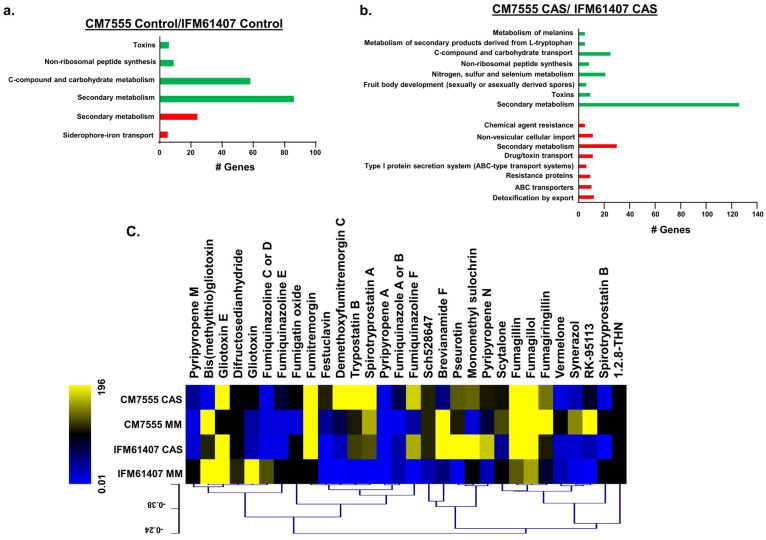
Figure 6.
Differentially expressed genes in CM7555 and IFM61407 clinical isolates are enriched for secondary metabolite and carbohydrate metabolism. (a,b) FunCat categorization analysis, showing the differentially expressed genes up- and downregulated in CM7555/IFM61407 clinical isolates in the presence and absence of CAS. (c) Heat map depicting the relative quantification divided by dry weight of differentially expressed secondary metabolites identified by mass spectrometry. Hierarchical clustering was performed in MeV (htpp://mev.tm4.org/, accessed on 29 September 2024), using Pearson’s correlation with complete linkage clustering. The results are the average of three independent biological repetitions.

