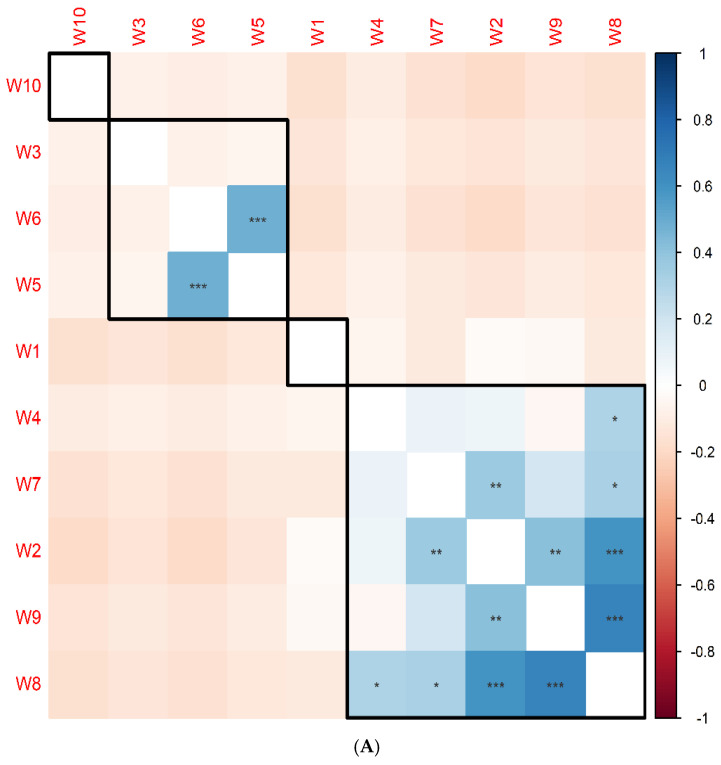
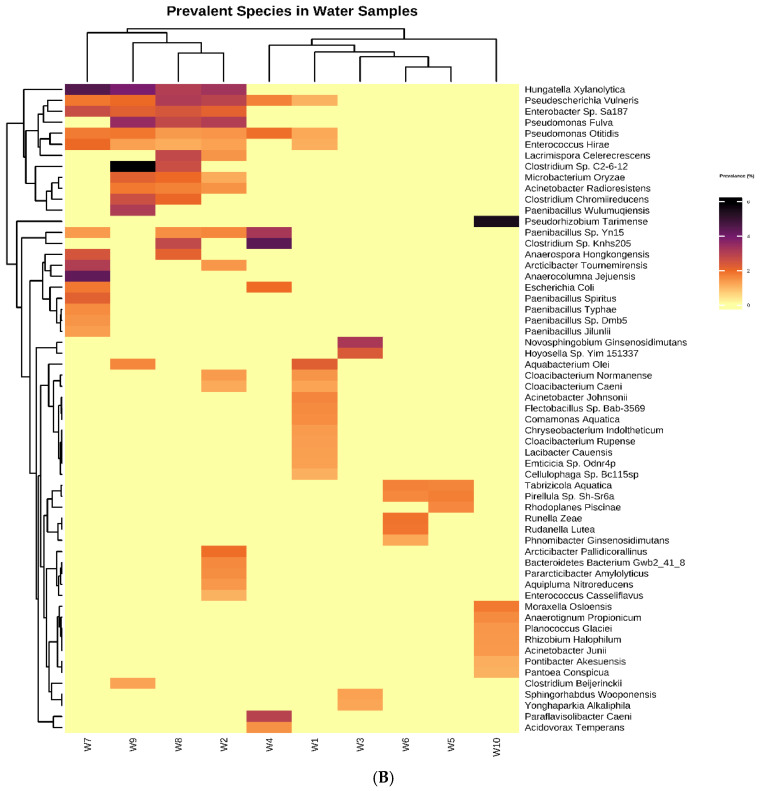
Figure 5.
(A) Correlation matrix illustrating the relationships between sediment samples based on bacterial species prevalence. (Pearson’s correlation. * p < 0.05, ** p < 0.01, *** p < 0.001) (B) Hierarchical clustering and heatmap visualizing the clustering of samples and the distribution of top prevalent species.


