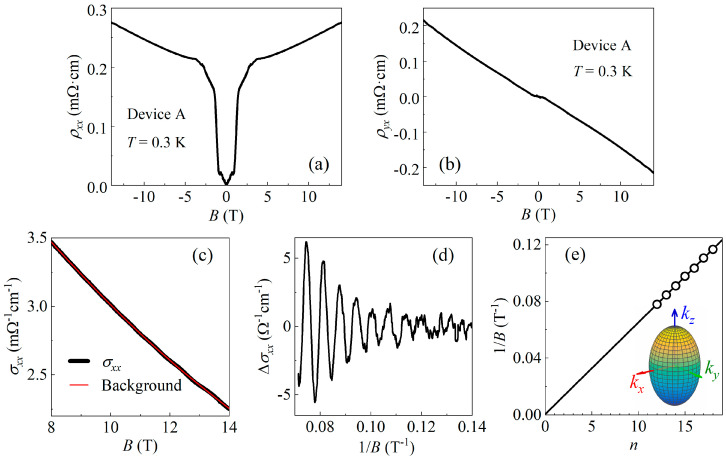
Figure 3.
(a,b) The and curves of device A, where was measured using electrodes #3 and #4, and was measured using electrodes #3 and #12. High-field data obtained using , showing clear SdH oscillations. (c) The background of classical magnetoconductivity was obtained by smoothing the curve, as shown by the red line in the figure. (d) The data obtained by subtracting the background, plotted against . (e) Landau fan diagram plotted using the minima of oscillations in (d). A linear fit to the data gives a zero intercept and a slope of 155 T. Inset: schematic diagram of the elliptical bulk Fermi surface of Bi2Se3.

