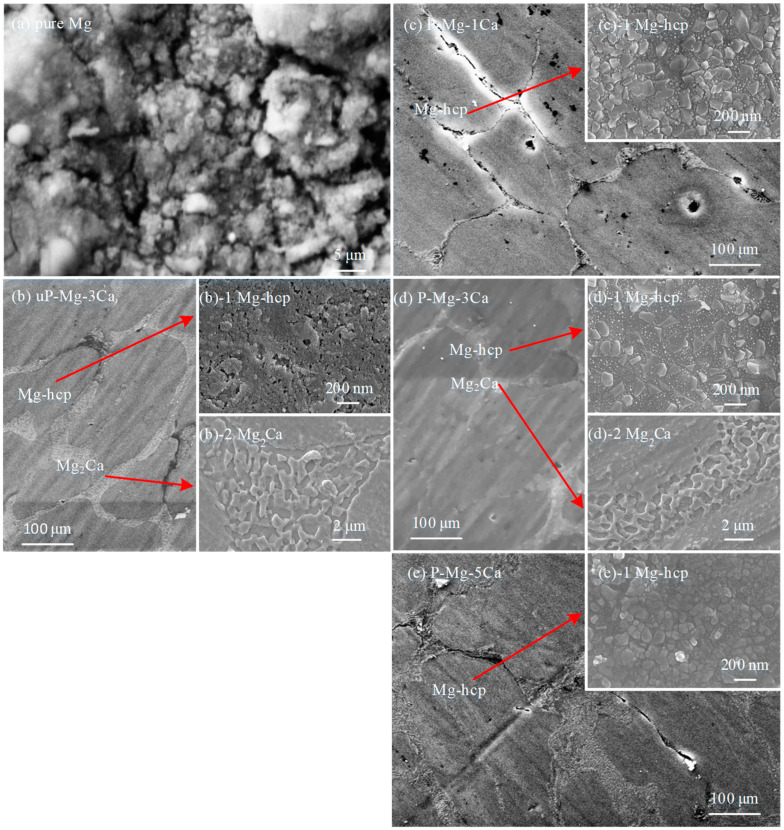
Figure 9.
Surface morphology images of pure Mg and Mg-xCa oxidized at 400 °C for 2 h, with SEM images of pure Mg after oxidation in (a), uP-Mg-3Ca in (b), P-Mg-1Ca in (c), P-Mg-3Ca in (d) and P-Mg-5Ca in (e). The inserts in (b–e), respectively, exhibit high magnification FESEM images of Mg-hcp of uP-Mg-3Ca in (b)-1, P-Mg-1Ca in (c)-1, P-Mg-3Ca in (d)-1 and P-Mg-5Ca in (e)-1, and also those of Mg2Ca of uP-Mg-3Ca in (b)-2 and P-Mg-3Ca in (d)-2.

