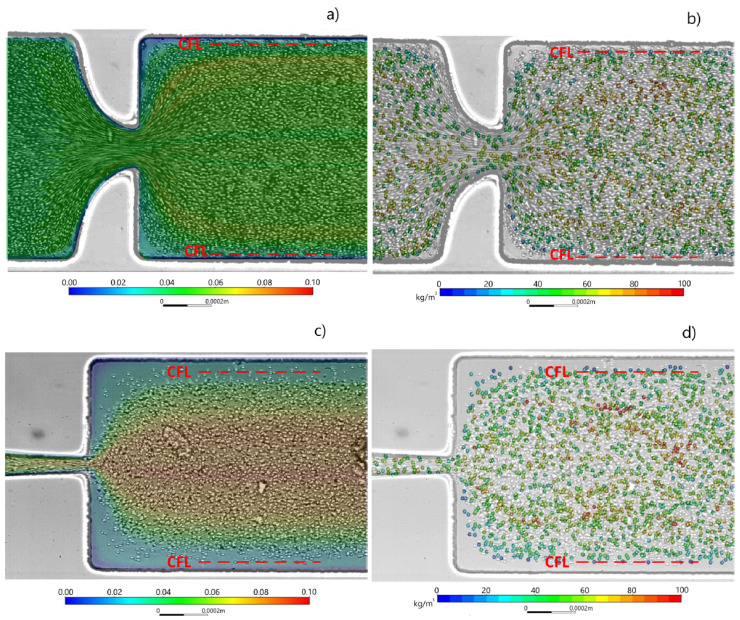
Figure 3.
Simulated volume fraction distribution of RBCs in two different kinds of hyperbolic microchannels. Models applied: (a) Euler–Euler, (b) Euler–Lagrange, (c) Euler–Euler, (d) Euler–Lagrange. The experimental data are presented as a background image, and the simulated RBC volume fraction is presented as a color map [100].

