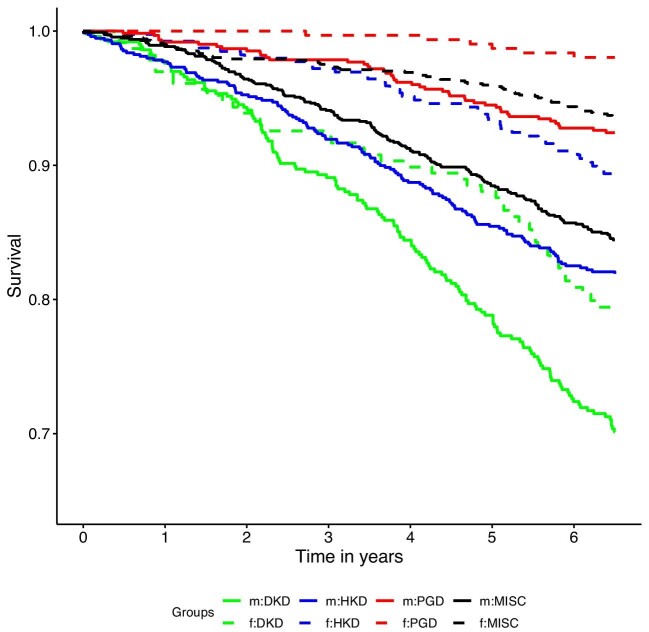
Figure 1:
Kaplan–Meier survival curve for all-cause mortality by sex and primary cause of kidney disease. Solid lines represent male (m) participants, dashed lines female (f) participants. Green: DKD as presumed primary cause of kidney disease; blue: HKD as presumed primary cause of kidney disease; red: PGD as presumed primary kidney disease; black: MISC = any other primary cause of kidney disease. Men diagnosed with DKD had the highest risk of death; women with DKD had a similar risk of death as men with HKD. Men with PGD were at similar risk of death as women with either HKD or MISC. Women with PGD had the lowest risk of death.

