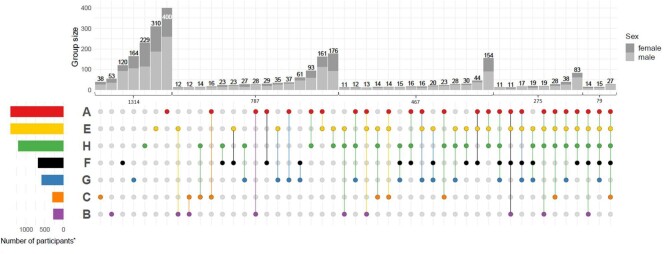
Figure 2:
Intersection plot of main adverse event categories and their combinations after 6.5 years of follow-up. Main event categories: cardiovascular (“A”), cerebrovascular (“B”), peripheral arterial occlusive disease (PAOD, “C”), kidney (“E”), death (“F”), cancer (“G”), infection (“H”). Plots include recurrent events. Colored intersection plot: indicates intersection of event combinations in main event categories, e.g. 176 participants experienced a combination of adverse kidney events and infection events until the end of the follow-up period, while a total of 787 participants experienced adverse events in two event categories overall. Stacked barplot: number of participants in each intersection by sex. Colored barplot: number of participants with events of a main event category is plotted. *Total number of participants with events in one to five event categories. Intersections with fewer than 11 participants are not shown here. In total, 11 participants had events in six event categories.

