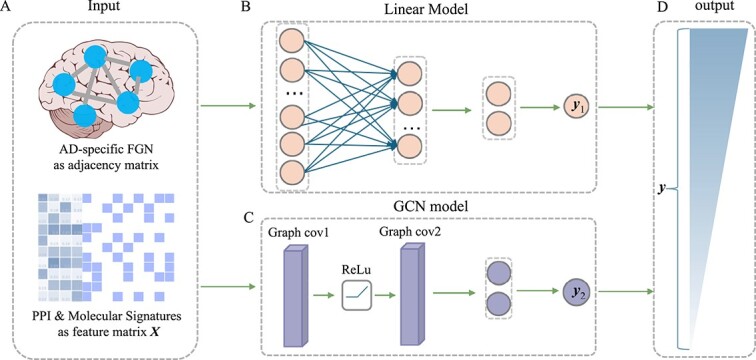
Figure 1.

Framework of LIMO-GCN. (A) The input of LIMO-GCN. It contains an adjacency matrix generated from AD-specific FGN and a feature matrix X, which is comprised of PPI from STRING database and molecular signatures from MSigDB. (B) The linear model of LIMO-GCN. (C) The GCN model of LIMO-GCN. (D) The output of vector y is taken as predicted score. Gene with a darker color indicates a higher association score with AD.
