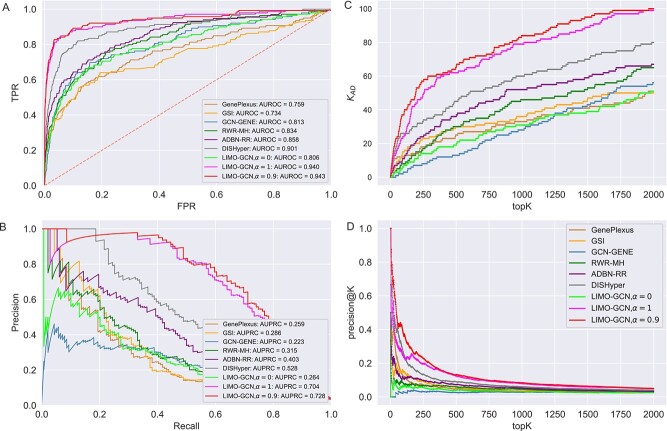
Figure 3.
Comparison of LIMO-GCN ( =0, 0.9, 1 with
  =0.4) with the state-of-the-art methods. (A) The area under the ROC curves of LIMO-GCN and other methods. (B) The AUPRC of LIMO-GCN and other methods. Comparison from No. of AD risk genes in topK and Precision@K. (C) Comparison of No. of AD risk genes in topK (
 stands for the number of AD risk genes in top K ranked genes.). (D) Comparison of Precision@K of LIMO-GCN and other methods.

