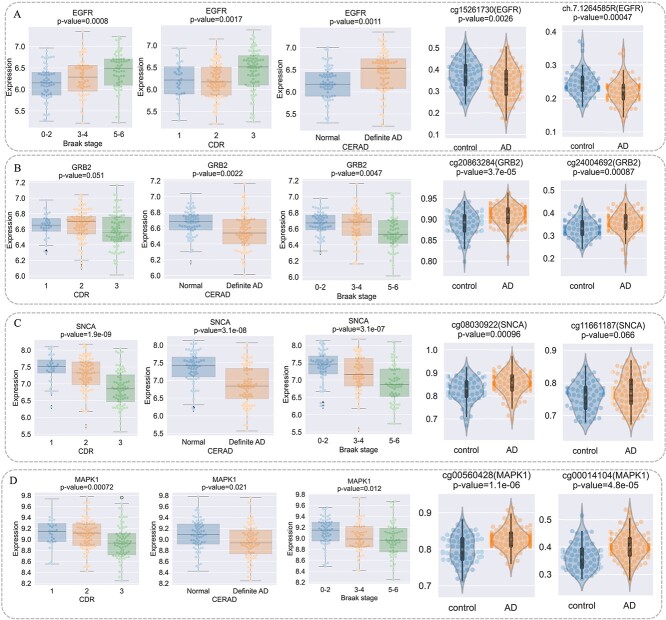
Figure 7.
The association analysis of EGFR2, GRB2, and TLR4 with AD from neuropathological traits and methylation perspectives. (A) Significant test of correlation between EGFR gene expression and Braak Stage score, CDR, CERAD, and differential methylation of cg15261730 and ch.7.1264585R, which are EGFR CpG sites. (B) Significant test of correlation between GRB2 gene expression and Braak Stage score, CDR, CERAD, and differential methylation of cg20863284 and cg24004692, which are CpG sites of GRB2. (C) Significant test of correlation between TLR4 gene expression and Braak Stage score, CDR, CERAD, and differential methylation of cg02515422 and cg08902905, which are TLR4 CpG sites. (D) Significant test of correlation between MAPK1 gene expression and Braak Stage score, CDR, CERAD, and differential methylation of cg00014104 and cg00560428, which are MAPK1 CpG sites.

