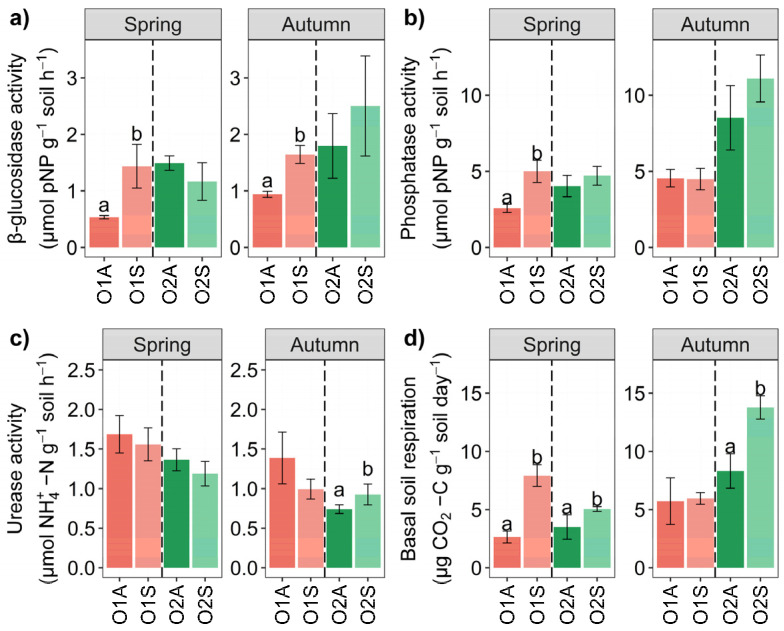
Figure 4.
Bar chart of β-glucosidase (μmol PNF g−1 soil h−1) (a), alkaline phosphatase (μmol PNF g−1 soil h−1) (b), urease (μmol NH4+ g−1 soil h−1) (c), and basal soil respiration (BSR) (mg CO2 kg−1 soil day−1) (d) of Orchard 1 and 2 in Spring and Autumn. The letters A and S indicate Asymptomatic and Symptomatic, respectively. Different letters (a, b) indicate significant differences based on One-Way ANOVA results at p < 0.05. Error bars represent the standard error of the mean (4 replicates).

